Have you ever watched a drone hover effortlessly over a construction site, inspect a wind turbine blade, or deliver medical supplies to a remote village?
That drone was almost certainly a multirotor.
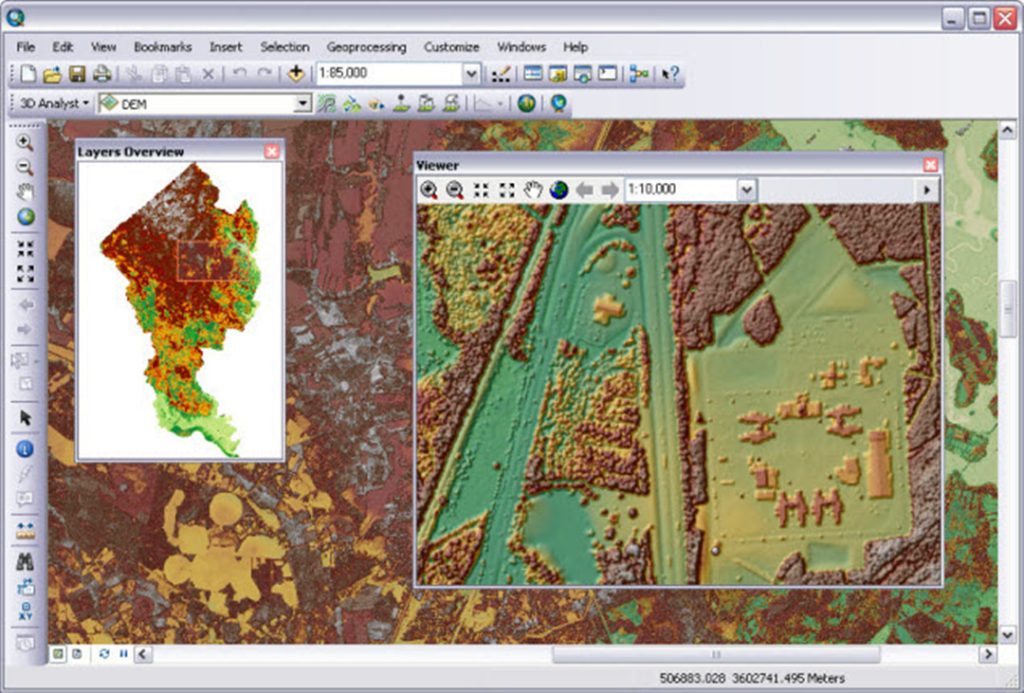
What is a Digital Elevation Model (DEM)?
A Digital Elevation Model (DEM) isn't merely a dataset; it's a dynamic three-dimensional representation of terrain, meticulously gridded with each cell holding a singular attribute - typically an elevation value.
Unlike other terrain models, DEM selectively filters out vector features such as streams, breadlines, and ridges, along with man-made structures and natural elements like buildings, towers, and vegetation.
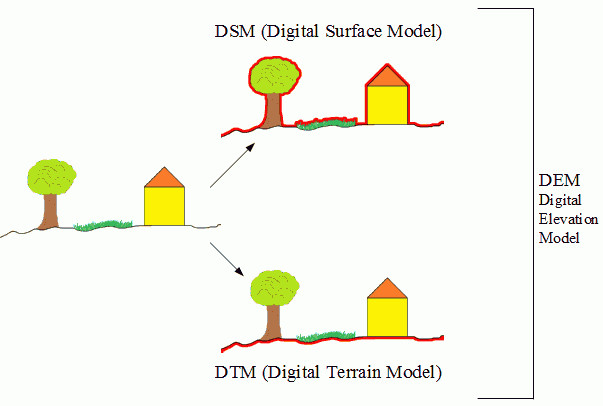
Essentially, DEM stands as the overarching term encompassing both Digital Surface Models (DSMs) and Digital Terrain Models (DTMs).
The differentiation between bare-earth and surface objects becomes blurred in DEMs, especially with spatial resolutions often exceeding 20 meters.
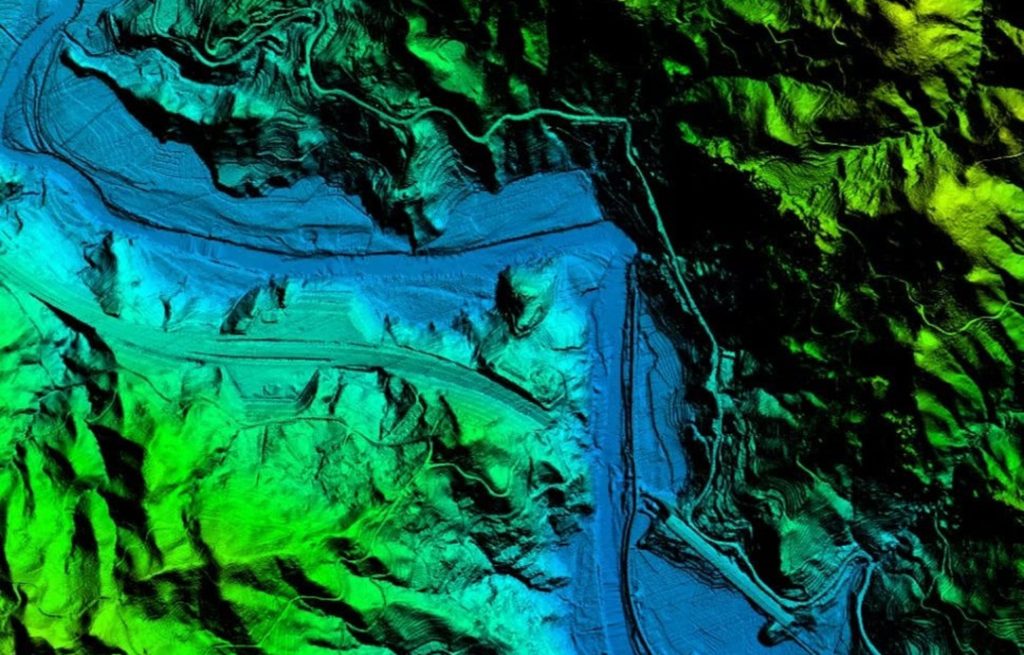
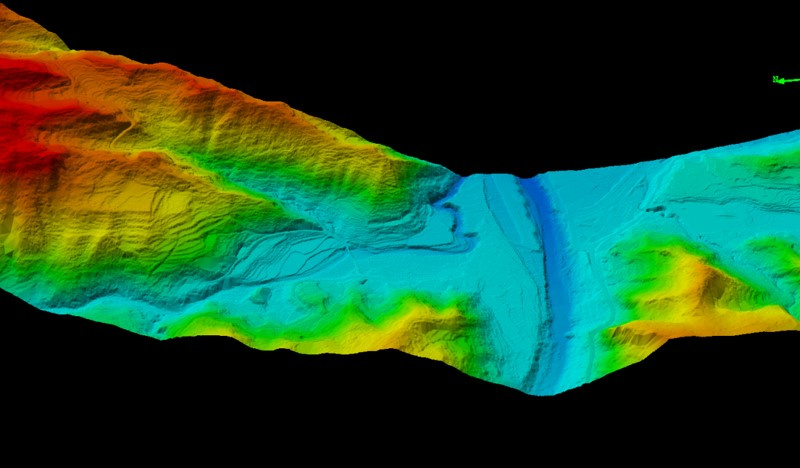
Yunnan Nonferrous Geological Bureau swiftly surveyed 950 sq. km of Yunnan Province's forests in 480 minutes using JOUAV CW-25E with JoLiDAR-LR22S. The DEM accurately captured the entire forestry environment. Read the full case study.
What Are the Uses of Digital Elevation Models?
The Digital Elevation Model (DEM) serves as a fundamental tool across various disciplines due to its multifaceted applications. The significance of DEMs spans critical domains such as land-use planning, infrastructural project management, soil science, hydrology, and flow-direction studies.
Modeling Water Flow and Mass Movements
DEMs enable accurate modeling of water flow and mass movements, including the prediction and analysis of phenomena such as landslides. By incorporating elevation data, researchers and planners can simulate the pathways of water and potential mass movements, aiding in the development of effective mitigation strategies.
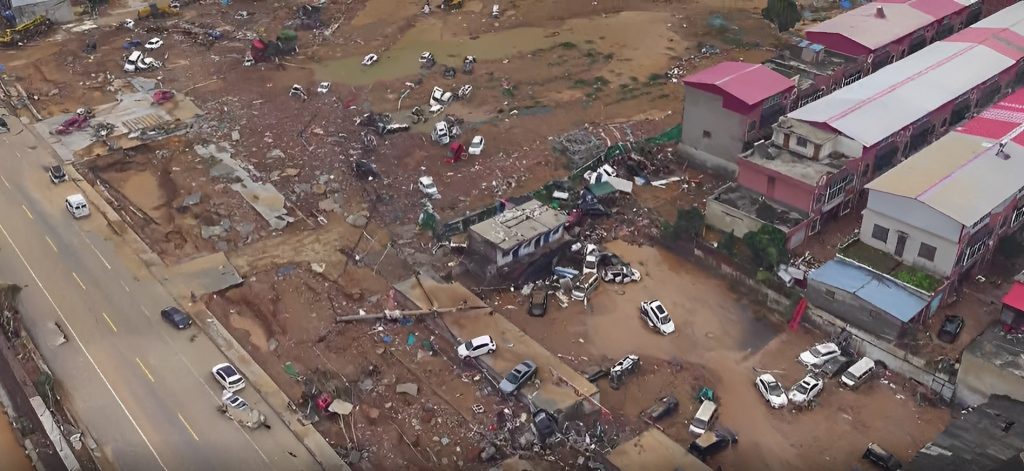
The oblique imagery of the Henan flood was captured by the CW-15 drone.
Creating Physical Models
The elevation data provided by DEMs facilitates the construction of physical models, such as raised-relief maps. These tangible representations are valuable tools for educational purposes, allowing individuals to visually comprehend the intricacies of the terrain and its features.
Rectifying Aerial Photography or Satellite Imagery
By integrating elevation information, these models correct distortions caused by varying terrain elevations, ensuring accurate georeferencing. This is particularly essential in applications where precise location data is imperative, such as in cartography and remote sensing.
Rendering 3D Visualizations
In geospatial technology, DEMs serve as the foundation for rendering three-dimensional visualizations. This capability is particularly advantageous for urban planning, environmental impact assessments, and virtual simulations, providing stakeholders with immersive and realistic representations of the terrain.
Reducing Gravity Measurements (Terrain Correction)
DEMs play a crucial role in the reduction of gravity measurements, particularly in fields like gravimetry and physical geodesy. Terrain correction, facilitated by DEMs, ensures that gravity anomalies are accurately interpreted by accounting for the influence of the underlying terrain, thereby refining the understanding of subsurface geological structures.
Analyzing Terrain in Physical Geography and Geomorphology
In physical geography and geomorphology, DEMs contribute significantly to terrain analysis. Researchers leverage elevation data to study landforms, analyze slope characteristics, and investigate the underlying processes shaping the Earth's surface. This information is invaluable for understanding landscape dynamics and formulating informed environmental management strategies.
What is a Digital Terrain Model (DTM)?
Digital Terrain Models (DTMs) are commonly regarded as synonymous with bare-earth DEMs, emphasizing their focus on representing the geodesic surface without considering persistent above-ground features such as vegetation, buildings, and artifacts.
The primary difference lies in the scope of information included in each model:
DEM vs. DTM
While DEMs consider all persistent ground features, such as vegetation and buildings, DTMs focus on the bare Earth's geodesic surface, excluding above-ground artifacts.
The essential disparity lies in the representation of terrain: DEMs include all objects, while DTMs prioritize the unadorned surface.
The term "bare-earth" in DEMs signifies the removal of surface features, ensuring that each cell denotes the elevation of the uncovered Earth surface.
In certain contexts, DTMs are perceived as vector datasets complementing DEMs, incorporating linear features like ridges and breaklines for an enhanced representation of bare-earth terrain.
DEMs depict Earth's surface features, incorporating both natural and artificial elements such as high-rise buildings.
In contrast, DTMs filter out man-made structures, providing a clearer representation of the unaltered ground surface.
In urban areas, DEMs may introduce inaccuracies due to building inclusion, whereas DTMs offer a more precise view of natural terrain, crucial for applications like flood modeling and infrastructure planning, especially in landscapes dominated by towering structures.
Regardless of the interpretation, a DTM is fundamentally a three-dimensional, digital representation of a surface, defined by X, Y, and Z coordinates.
This representation encapsulates not only elevations and heights but also natural features such as rivers and ridge lines.
The combination of these coordinates offers a comprehensive view of the Earth's topography.
How Are Digital Terrain Models Created?
The creation of a DTM involves the collection and processing of elevation and terrain shape data, with a focus on capturing surface discontinuities and special locations such as peaks, pits, ridges, and changes in slope.
The following methods are employed to gather the necessary data for DTM generation:
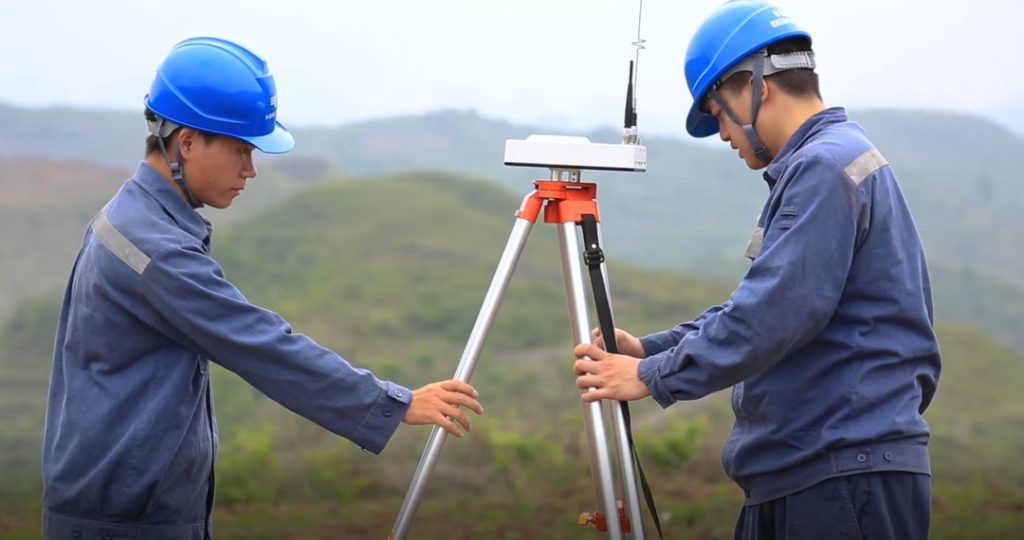
Ground Surveys
Ground surveys involve on-site measurements conducted by surveyors to capture accurate elevation data for specific areas.
This technique is renowned for its precision, especially in capturing details of surface discontinuities and unique topographic features.
However, ground surveys can be time-consuming and are typically applied to smaller study areas or specific projects.
The introduction of the Global Positioning System (GPS) has significantly enhanced the efficiency of ground surveys.
GPS relies on a constellation of satellites transmitting continuous time and position information, allowing users to determine their positions on Earth with remarkable accuracy, often within meters.
Photogrammetry Using Aerial Photographs
This technique extends the coverage beyond the limitations of ground surveys, making it suitable for larger study areas, even at a national scale.
Aerial photographs are captured and processed using photogrammetric methods to derive elevation data.
The accuracy of the resulting DTM depends on factors such as the quality of the aerial imagery, the calibration of the camera, and the processing techniques employed.
This method is efficient for capturing detailed terrain information over expansive regions.

Satellite images
Satellite imagery is another valuable source for DTM creation, offering a broader perspective that is particularly useful for large-scale mapping.
Similar to photogrammetry, the accuracy of DTMs derived from satellite images depends on the resolution and quality of the imagery.
Advanced satellite technologies, such as those equipped with high-resolution optical sensors and synthetic aperture radar (SAR), contribute to the precision of elevation data extraction.
These satellite-derived DTMs are instrumental in applications ranging from regional planning to environmental monitoring.
Digitizing or Scanning Existing Maps
Historical maps or topographic sheets can also be employed for DTM creation through digitization or scanning processes.
While this method may lack the real-time accuracy of ground surveys or contemporary satellite technologies, it remains a valuable resource for areas with limited data availability.
Digitization and scanning techniques, when coupled with modern geospatial software, allow for the extraction and interpolation of elevation data to construct comprehensive DTMs.
What is the DTM Model Used for?
The primary utility of DTM lies in its capacity to facilitate sophisticated terrain analyses, offering valuable insights into topographical features, including slope and aspect calculations, hydrological modeling, and geological assessments.
Hydrological Modeling
In the realm of hydrology, DTM models contribute significantly to the simulation of various hydrological phenomena, such as river flow, watershed delineation, and the identification of potential flood-prone areas. Consequently, hydrological models based on DTMs aid in the formulation of effective water resource management strategies and the design of resilient infrastructure.
Terrain Analysis
DTMs play a pivotal role in terrain analysis, enabling the calculation of essential parameters such as slope and aspect. The precision afforded by DTM facilitates detailed assessments of the topographical characteristics of a given area, offering insights critical for various applications, including environmental impact assessments, urban planning, and infrastructure development.
Land-Use Studies
DTMs are vital in land-use studies, offering a detailed representation of the terrain that aids in identifying suitable areas for specific land uses. This includes urban planning, agricultural zoning, and conservation efforts. The information derived from DTMs supports sustainable land management practices by considering topographical factors in decision-making processes.
Transportation System Planning
In the context of transportation planning, DTMs contribute to route optimization, road design, and the evaluation of potential challenges such as steep slopes or difficult terrain. This enhances the efficiency and safety of transportation networks by incorporating topographical considerations into the planning and design phases.
Visualization and Modeling
DTMs serve as foundational elements in the creation of physical raised-relief maps, flight simulator programs, and various visualization and modeling applications. The accurate representation of terrain facilitates realistic simulations, benefiting fields such as urban planning, defense, and virtual training environments.
Geographic Information Systems (GIS)
Digital terrain models seamlessly integrate with GIS, providing a spatial framework for analyzing, interpreting, and visualizing complex geospatial data. This integration enhances the capabilities of GIS platforms, allowing for more robust spatial analysis and decision support across a multitude of disciplines.
What is a Digital Surface Model (DSM)?
A Digital Surface Model (DSM) serves as a comprehensive three-dimensional representation of the Earth's surface, encompassing both natural topography and anthropogenic structures such as vegetation and buildings.
It meticulously captures the elevations of reflective surfaces, including any features that rise above the "bare earth."
In essence, DSMs provide a holistic portrayal of the Earth's surface and all entities present on it.
The utilization of DSMs confers numerous advantages.
Primarily, they offer an accurate representation of the Earth's surface, enabling precise measurements and informed decision-making processes.
The integration of 3D visualization enhances the interpretability of geographical features, providing users with a realistic and immersive experience.
DTM vs. DSM
A Digital Terrain Model focuses exclusively on the bare earth's topography, excluding above-ground features. It provides a representation of the Earth's surface devoid of buildings, vegetation, and other structures, making it ideal for analyses requiring a clear depiction of ground relief.
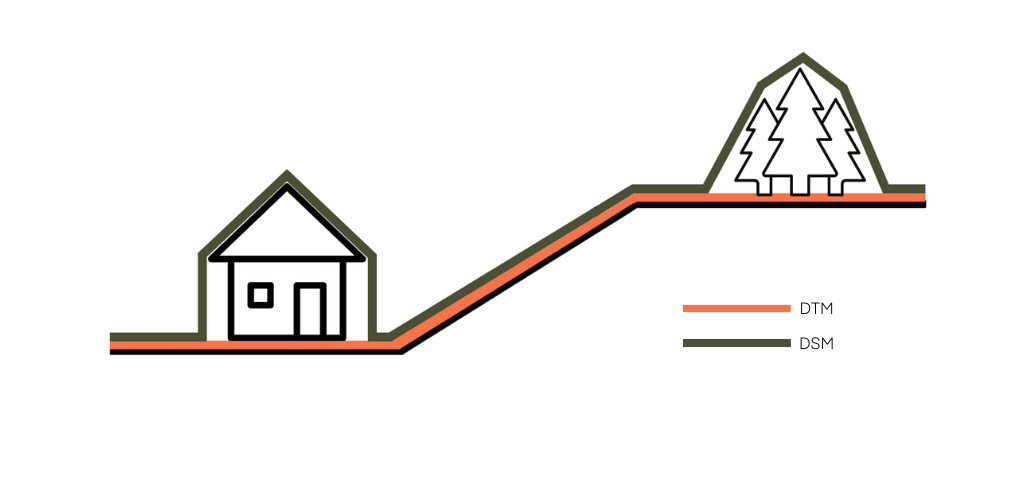
DTM vs. DSM. Source from heliguy.com
In contrast, a Digital Surface Model encompasses the elevations of both the terrain and all surface features. DSMs include built structures, vegetation, and any other objects on the Earth's surface, offering a more comprehensive view suitable for applications where above-ground elements play a crucial role.
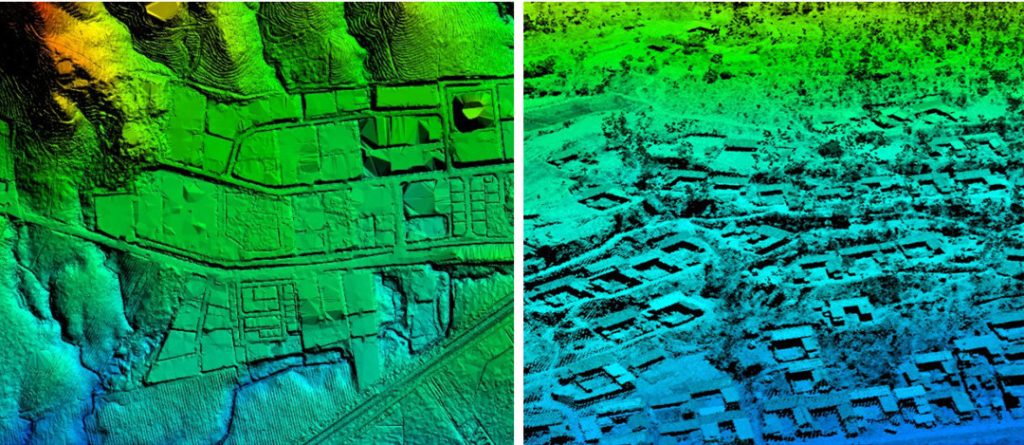
The difference between DSM and DTM
How Are Digital Surface Models Created?
The creation of DSMs involves advanced technologies such as LiDAR (Light Detection and Ranging) and stereo photogrammetry, each offering distinctive methodologies for comprehensive mapping.
LiDAR
In LiDAR systems, beams of light pulses are emitted from a LiDAR unit towards the ground.
Upon encountering surrounding objects, these pulses bounce back to the sensor. The sensor, through precise time measurements, calculates the distance each pulse traveled.
Beyond distance, the sensor gauges the intensity of the returned pulses, providing insights into the surface geometry and material composition of the reflecting surfaces.
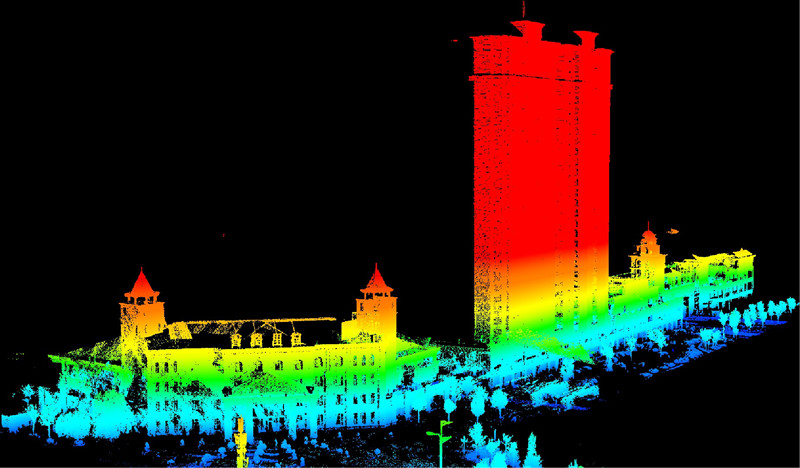
The outcome is a comprehensive point cloud, capturing elevation values with precision, down to features such as tree canopies and building structures.
Despite the efficacy of LiDAR, its implementation can be cost-prohibitive, often reserved for smaller, high-value areas like urban centers.
Stereo Photogrammetry
An alternative approach to DSM generation involves automated image matching through high-resolution optical stereo images or stereo photogrammetry.
This technique relies on the triangulation of corresponding pixels in pairs of stereo images, utilizing known exterior and interior orientations for 3D reconstruction.
These stereo image pairs can be sourced from aerial platforms or satellites. Regardless of the source, manually measured object heights from oriented images serve as a reference point.
Advanced computer vision algorithms, in conjunction with these reference measurements, contribute to the final DSM results.
Photogrammetry, in this context, becomes accessible and scalable through the utilization of various open-source and commercial tools.
Among the notable algorithms employed in this process is the Semi-Global Matching (SGM) algorithm.
Recognized for its commendable trade-off between runtime efficiency and accuracy, SGM plays a pivotal role in programmatically deriving elevation data from stereo images.
This amalgamation of technology and algorithmic precision empowers the creation of DSMs, providing an encompassing and detailed perspective of the features that extend from the Earth's surface.
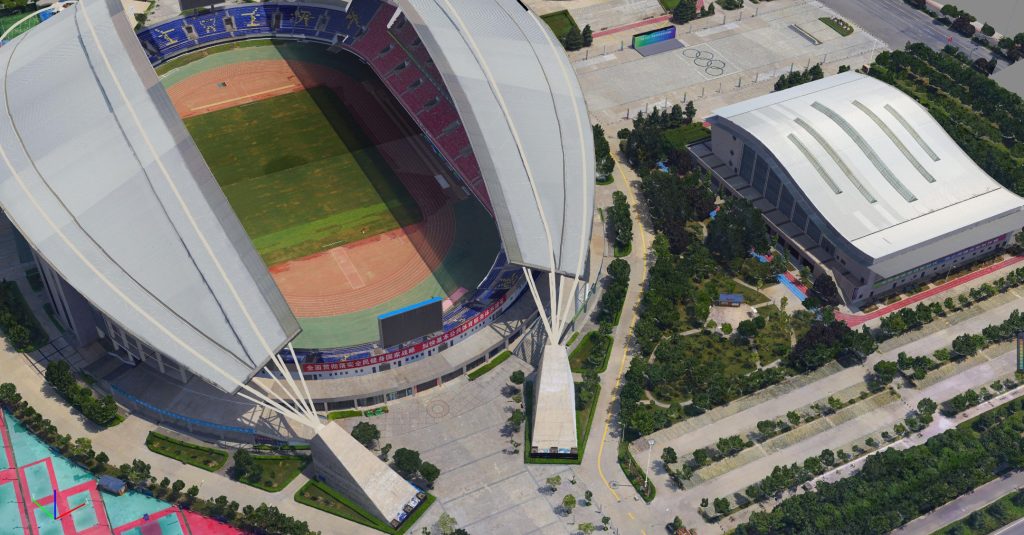
The 3D model of Weinan Stadium was crafted with precision using a cutting-edge CW-15 VTOL drone, paired seamlessly with the PH-7E multi-rotor. Each of these drones was equipped with a high-tech CA-503R oblique camera, capturing intricate details to bring the stadium to life in three dimensions.
What is the DSM Model Used for?
The Digital Surface Model (DSM) serves as a fundamental geospatial dataset with diverse applications across several domains, contributing to enhanced planning, analysis, visualization, and modeling capabilities.
Urban Planning and Architectural Design
DSMs play a crucial role in urban planning and architectural design by providing detailed information about the existing terrain and above-ground structures. Urban planners use DSMs to assess the impact of new constructions on the surrounding environment, analyzing factors such as sunlight exposure, views for residents, and effects on businesses. Architects utilize DSMs to visualize how proposed structures integrate with the existing landscape.
Tourism and Virtual Tours
The tourism industry leverages DSMs for destination planning, allowing stakeholders to assess topographical features and landmarks. Additionally, DSMs facilitate the creation of virtual tours, offering a realistic representation of geographical features and architectural elements.
Navigation Systems and Intelligent Transport Systems
DSM data is instrumental in navigation systems, facilitating precise route planning and navigation by incorporating surface features into the analysis. Intelligent Transport Systems leverage DSM for traffic management, road design, and infrastructure planning.
Forecasting Urban Risks
The DSM's ability to capture surface features aids in forecasting urban risks, such as flooding and landslides. By integrating elevation data with predictive models, urban planners, and emergency management officials can assess and mitigate potential risks more effectively.
Mapping Natural Disaster
By integrating data on surface features, DSMs contribute to more accurate risk assessments related to factors such as flooding, landslides, and other natural disasters. This information is invaluable for urban planners and emergency management authorities in developing strategies to mitigate and respond to potential risks.
Power Line Corridor Inspections
Beyond urban planning, DSMs are employed in infrastructure management, such as power line corridor inspections. Utilities and maintenance teams use DSMs to analyze vegetation encroachment, assess the condition of power lines, and plan for necessary maintenance and upgrades.
The Simple Breakdown Of DEM vs. DTM vs. DSM
Before we jump into the nitty-gritty of where to snag elevation data, let's quickly run through what sets these three amigos apart: DEM, DTM, and DSM.
DEM vs. DTM vs. DSM
Digital Elevation Model (DEM)
DEM serves as the foundational model, providing a comprehensive representation of bare earth elevation. This model includes natural terrain features, excluding any structures or vegetation.
DEMs find widespread use in digital cartography and geographic information systems (GIS), serving as the fundamental dataset for terrain representation.
Digital Terrain Model (DTM)
DTM is an extension of DEM, enriched with additional features such as breaklines and ridges. Unlike DEM, DTM incorporates finer details, making it particularly valuable for applications requiring a more intricate representation of the terrain.
DTMs play a crucial role in flood and drainage modeling, land-use studies, geological applications, and even extend to planetary science.
Digital Surface Model (DSM)
DSM encapsulates the complete topography, including both natural and anthropogenic features on the Earth's surface. This encompasses buildings, vegetation, and other structures.
DSMs are especially preferred in applications such as telecommunications, landscape modeling, city modeling, and visualization, where a holistic representation of the surface is imperative.
What is the Resolution of the Digital Elevation Model?
The resolution of a Digital Elevation Model (DEM) is a multifaceted concept encompassing three pivotal dimensions: spatial resolution, vertical resolution, and temporal resolution.
Spatial Resolution
The spatial resolution of a Digital Elevation Model refers to the level of detail in representing the Earth's surface, expressed as the size of grid cells or pixels (e.g., 30 meters per pixel).
It depends on the spacing between sample points, crucial for project suitability.
This distance varies, from uniformity in stereoscopic imagery to consistency in RADAR/LiDAR and high variability in manually acquired DEMs.
![]()
DEM output pixel density examples. Source from esri.com
Vertical Resolution
Vertical accuracy, or vertical resolution, is a key determinant of a DEM's quality.
It gauges the potential height difference between the modeled or detected elevation and the ground-truthed elevation of the actual surface.
Various methods, such as radar, LiDAR, or photogrammetry, yield differing accuracy levels.
LiDAR generally provides superior spatial and vertical resolutions, though its widespread application can be hindered by cost considerations.
It's noteworthy that different DEM providers may present distinct definitions of vertical resolution or accuracy, underscoring the importance of understanding these nuances when assessing data quality.
Temporal Resolution
The temporal resolution of a DEM considers how recently the elevation data used to generate it was acquired.
This becomes particularly relevant for change analysis or when studying temporally variable phenomena like vegetation growth or new construction using a Digital Surface Model (DSM).
Being aware of the temporal aspect is crucial for ensuring that the elevation data aligns with the timeframe of the specific project or application.
Where to Find Digital Elevation Model Data Sources?
In the pursuit of enhancing your geospatial data capabilities, securing accurate and reliable Digital Elevation Model (DEM) data is paramount. Here, we present a refined exploration of five free global DEM data sources:
1. Space Shuttle Radar Topography Mission (SRTM)
The Space Shuttle Radar Topography Mission (SRTM) stands out as a pioneer in capturing Earth's topography. Launched in 2000 aboard the space shuttle Endeavour, SRTM employed synthetic aperture radar and interferometry during its 11-day mission. The resulting DEM, available at one arc-second (30 meters) resolution, covers over 80% of the Earth's surface.
Key Features:
- Absolute vertical height accuracy of less than 16m.
- Available for free on the USGS Earth Explorer.
- Substantial improvement from 90-meter to 30-meter resolution after September 2014.
Downloading SRTM Data:
To access SRTM data, visit the US Geological Survey’s EROS Data Center or utilize the USGS Earth Explorer.
Select your area of interest under the data sets tab, then navigate to Digital Elevation > SRTM > SRTM 1-ArcSecond Global. A comprehensive guide is available through GIS Geography.
2. ASTER Global Digital Elevation Model
The ASTER Global Digital Elevation Model (GDEM) is a collaborative effort between NASA and the Ministry of Economy, Trade, and Industry (METI) of Japan. Boasting a global resolution of 90 meters and 30 meters in the United States, ASTER GDEM provides extensive coverage—approximately 80% of the Earth's surface.
Key Features:
- Utilizes stereoscopic pairs and digital image correlation methods for elevation measurement.
- High resolution and wide coverage.
- Improved data quality over time with artifact corrections.
Downloading ASTER GDEM:
Access ASTER DEM data for free from NASA Earthdata, Japan Space Systems, and the USGS Earth Explorer by selecting Digital Elevation > ASTER.
3. JAXA’s Global ALOS World 3D
The ALOS Global Digital Surface Model, or ALOS World 3D, is a global Digital Surface Model (DSM) dataset provided by the Japanese Aerospace Exploration Agency (JAXA). Generated from images collected using the Panchromatic Remote-sensing Instrument for Stereo Mapping (PRISM) aboard the Advanced Land Observing Satellite (ALOS), this dataset offers a horizontal resolution of approximately 30 meters.
Key Features:
- DSM dataset with a horizontal resolution of 30 meters.
- Generated from images collected between 2006 and 2011.
- Available to the public for free.
Downloading JAXA’s Global ALOS World 3D:
To access this accurate DSM, registration is required through the JAXA Global ALOS portal.
4. Light Detection and Ranging (LiDAR)
As the world embraces LiDAR technology, it has become a valuable resource for obtaining high-precision elevation data. LiDAR's spatial and vertical accuracy is often unparalleled, making it an ideal source for DEM creation.
Key Features:
- Unmatched spatial and vertical accuracy.
- Allows for the creation of both Digital Terrain Models (DTMs) and Digital Surface Models (DSMs).
- Various sources include Open Topography, USGS Earth Explorer, and NEON Open Data Portal.
Locating LiDAR Data:
Access LiDAR data through online platforms like Open Topography, USGS Earth Explorer, and the NEON Open Data Portal. Additionally, consider reaching out to local or regional government agencies, as they may provide LiDAR data for free, contingent on the intended use.
5. Mars Orbiter Laser Altimeter (MOLA)
Beyond Earth, elevation mapping extends to other celestial bodies, including Mars. The Mars Orbiter Laser Altimeter (MOLA) instrument has enabled scientists to map ancient streams on the Martian surface.
Key Features:
- MOLA instrument used for mapping Mars' rugged terrain.
- Examples include the Mars Terrain map, utilizing MOLA data.
Downloading MOLA DEM of Mars:
The USGS Astrogeology Science Center serves as the DEM data hub for Mars, providing elevations above the areoid from a Martian gravity field solution (GMM-2B) with a total elevation uncertainty of at least ±3m.
How to Make Digital Elevation Model from Point Clouds with ArcGIS Pro?
Step 1: ArcGIS Pro Project Setup
To initiate the process, launch ArcGIS Pro and initiate a new project. Be mindful that the 3D Analyst Extension or the Spatial Analyst Extension is essential for most steps in this tutorial.
When commencing a new ArcGIS Pro project, consider establishing a connection to the directory or folder containing LiDAR or other data. This accelerates data access and streamlines the browsing process by reducing the number of files to navigate through.
Step 2: Create a New Map
Before crafting data layers, generate a new "Map" in ArcGIS Pro to organize and visualize the forthcoming data layers. Navigate to the Insert tab, and select the New Map icon. With a new map open, any data generated during the analysis will automatically be visible.
Step 3: LAS Metadata
Prior to importing LiDAR point clouds into a GIS, understanding the spatial reference system or coordinate system of the data is crucial, both horizontally and vertically. Often, this information is not embedded in the LAS file and can significantly impact processing accuracy.
Usually, the LiDAR data provider includes a metadata document detailing the dataset, including file names, spatial reference system information, data extent, and collection accuracy.
Step 4: Create LAS Dataset
A LAS Dataset is a means by which ArcGIS Pro stores directions to LiDAR files and allows for specific parameters to be set. This facilitates accessing point cloud data without modifying the source data. Multiple LiDAR files can be added to the LAS Dataset, simplifying the inclusion of larger areas for analysis without merging .las files.
To create the LAS Dataset, access the Analysis tab, click on the Tools icon, and either search for "Create LAS Dataset" or navigate through Toolboxes -> Data Management Tools -> LAS Dataset -> Create LAS Dataset. Specify the input LAS file, customize the name, and leave other parameters as default before running.
Step 5: LAS Dataset Properties - Ground Points Only
Once the LAS Dataset is created, it appears as a new layer in the active map. Adjust parameters to filter out non-ground points. This can be done by right-clicking on the LAS Dataset layer and selecting Ground from the LAS Filters dropdown or by accessing Properties and configuring settings under the LAS Filter category.
Step 6: Create DEM
The final step involves converting LAS Dataset points to a raster using the Conversion Toolset, requiring either the 3D Analyst or Spatial Analyst license. This involves using the binning method and Inverse Distance Weighting (IDW) for raster cell values. The tool also offers Natural Neighbor interpolation to fill any DEM gaps.
Access the tool by clicking on the Analysis tab, selecting the Tools icon, and searching for "LAS Dataset to Raster" or navigating through Toolboxes -> Conversion Tools -> To Raster -> LAS Dataset to Raster. Configure key parameters such as input LAS Dataset, output raster path, interpolation type, and void fill method before executing the tool.
Step 7: Validate Results
The final validation step includes generating a Hillshade raster from the DEM to assess the terrain and identify potential errors. Various hillshade rasters with different azimuth and altitude settings can be created to observe the impact on terrain visualization.
Access the hillshade tools depending on your licensing, found in Spatial Analyst Tools toolbox -> Surface -> Hillshade for Spatial Analyst License or 3D Analyst Tools toolbox -> Raster Surface -> Hillshade for 3D Analyst License. Experiment with parameters to optimize the visualization of the terrain based on your specific dataset.
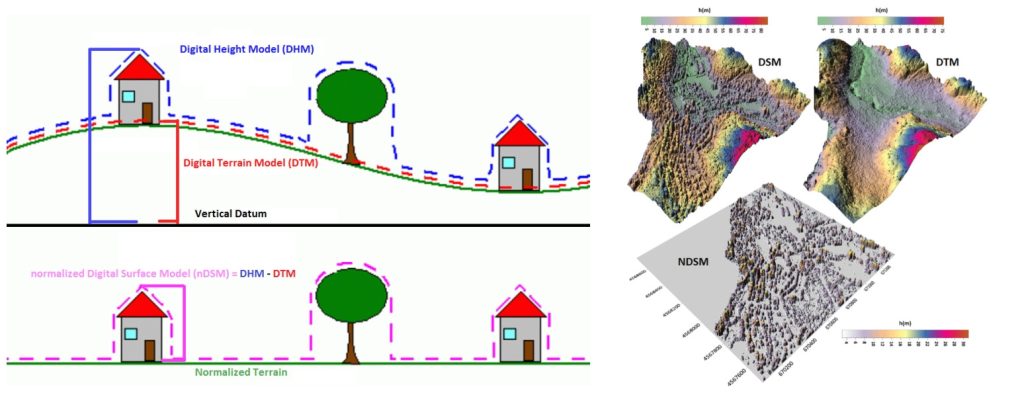
How to Normalize Digital Surface Model?
A normalized digital surface model (nDSM) is a valuable elevation product that provides insights into the relative height of features compared to the surrounding ground.
Creating an nDSM involves a straightforward process of subtracting a Digital Terrain Model (DTM) from a Digital Surface Model (DSM). Follow these steps to normalize a DSM and generate an nDSM:
1. Prepare Your Data
Ensure you have a Digital Surface Model (DSM) and a Digital Elevation Model (DEM) for the same area. These models can be derived from lidar point cloud data using software like ArcGIS Pro or other GIS tools.
2. Access Raster Functionality
Open your GIS software, such as ArcGIS Pro, and access the raster functionality. This is where you'll perform the normalization process.
3. Identify DSM and DEM Layers
Load both the DSM and DEM layers into your GIS project. These layers should cover the same spatial extent and have the same resolution to ensure accurate normalization.
4. Subtract DEM from DSM
Utilize the raster calculator or similar tools in your GIS software to subtract the DEM from the DSM. The formula for normalization is:
NDSM = DSM - DEM
This operation creates the Normalized Digital Surface Model (NDSM).
5. Adjust Pixel Values (Optional)
Depending on the software you're using, you may want to adjust pixel values for better visualization. For instance, you can set negative values to zero or apply a color ramp to highlight variations in height.
6. Visualize and Analyze
Once the NDSM is created, visualize the results in your GIS software. The pixel values in the NDSM represent the height above ground. You can use this information for various analyses, such as identifying features like buildings, trees, or other structures.
7. Enhance Cartographic Appearance (Optional)
To improve the cartographic appearance, consider generating a hillshade layer using raster functionality. Position the hillshade layer beneath the NDSM layer and apply transparency and symbology to the NDSM layer. This enhances the visualization and makes it easier to identify features on the landscape.
8. Save or Export the NDSM
Once satisfied with the normalized results, save or export the NDSM layer as needed. This might involve saving it as a raster file or within the project file of your GIS software.
How to Calculate Slope in Digital Elevation Model?
Here, we'll guide you through the process of calculating slope from a Digital Elevation Model (DEM) using QGIS. It's a straightforward procedure, so let's dive right in.
1. Open QGIS and Load Your DEM: Ensure you have your digital elevation model ready. In my case, I have a DEM with elevations ranging from 2 to 3 meters, and it has a resolution of 30 meters.
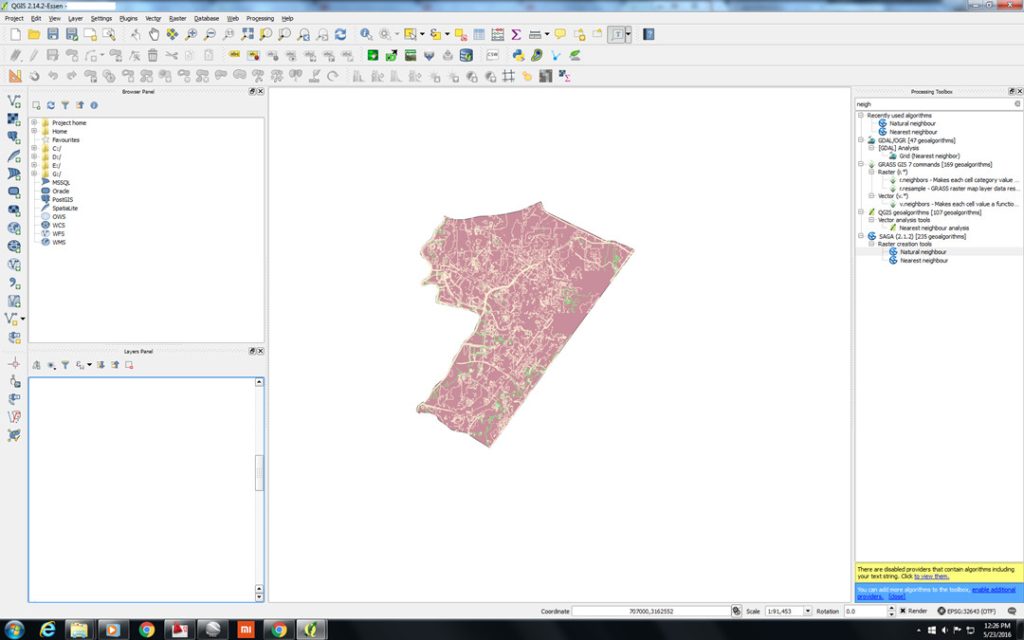
2. Access the Slope Tool: You can access the slope calculation tool in two ways. Either navigate to the Raster Analysis menus or use the Processing Toolbox by pressing Ctrl+Alt+T. If you need to add or remove the toolbox, press Ctrl+Alt+T again.
3. Search and Select the Slope Tool: In the Processing Toolbox, search for "slope" and double-click on the tool that appears. This will open the tool interface.
4. Choose the Elevation Layer: By default, QGIS will select the current layer as the elevation layer. Ensure it is the correct DEM you want to calculate the slope for.
5. Run the Slope Tool: Simply hit the "Run" button, and QGIS will perform the slope calculation based on the chosen DEM layer.
6. Visualize the Slope: Turn off the original DEM layer and take a look at the newly generated slope layer. You can observe the areas with varying slopes, and QGIS assigns color gradients to represent the differences in slope.
7. Adjust Colorization (Optional): If you want to enhance the visual representation, you can experiment with different color spectrums. In the tutorial, I chose a new color spectrum to highlight slope variations.
8. Interpret the Results: By analyzing the slope map, you can identify areas with the steepest slopes. In this example, the highest slope difference is 43 points. You can cross-reference this information with your map to identify specific terrain characteristics.
Read More


Every drone needs a brain.
Without it, you’re holding an expensive paperweight with spinning blades.
That brain is called a flight controller—but most people have no idea what it actually does.

Let’s be honest: the drone world loves its acronyms. UAV, UAS, drone, RPAS, UCAV, FPV–it’s an alphabet soup. And most people use them like they’re the same thing.
They’re not.
And here’s why that matt

JOUAV Product News and Use Cases
Fixed-Wing VTOL Drones Insights and Industry Trends
Invitations to online demo events