Have you ever watched a drone hover effortlessly over a construction site, inspect a wind turbine blade, or deliver medical supplies to a remote village?
That drone was almost certainly a multirotor.
What Are the Benefits of Point Cloud Surveys?
Point cloud surveys, a cutting-edge mapping technique, offer a wide range of benefits over older methods. Let's explore these advantages in details:

Exceptional Precision
Point cloud surveys offer 100% accuracy, down to the millimeter. This eliminates errors in mapping, ensuring cost control and timely issue resolution, saving time, cost, and energy in real-world projects.

Improved Efficiency
Traditional surveys take hours or days, while point cloud technology does the job in a fraction of the time. This not only minimizes disruption but also provides access to vital design data much faster.

Comprehensive Data Capture
They capture detailed data, including geometry, colors, and intensity information. This comprehensive data can be used for a wide range of purposes, from building assessments to archaeological research.

Enhanced Visualization
The 3D point clouds allows for immersive and interactive visualization. It enables professionals to explore and analyze environments and structures from various angles.
Precision Mapping and Surveying
Point cloud data creates super-detailed 3D maps of places, like landscapes and buildings. It's like having a laser-powered ruler and protractor. Surveyors use it to measure distances, angles, and even volumes with mind-blowing accuracy. This helps in projects that need incredibly precise mapping.
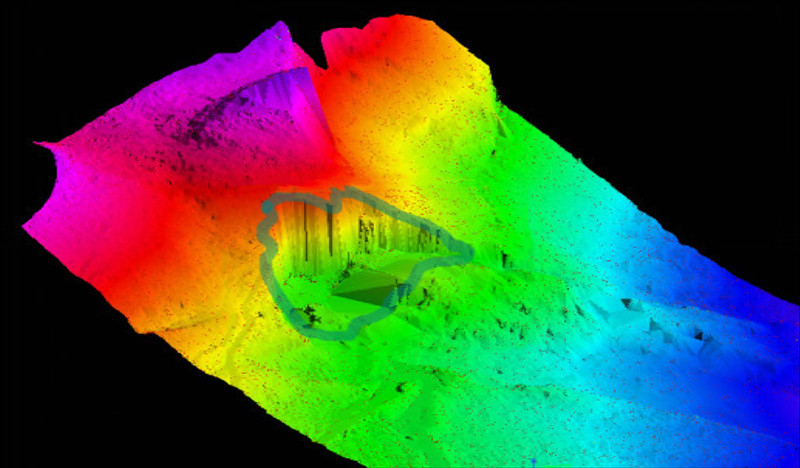
Disaster Modeling
This 3D point cloud data, often obtained through LiDAR or photogrammetry, aids in terrain assessment, flood modeling, landslide prediction, earthquake preparedness, damage assessment, and search and rescue operations. This data helps authorities make informed decisions and manage disaster risk effectively.
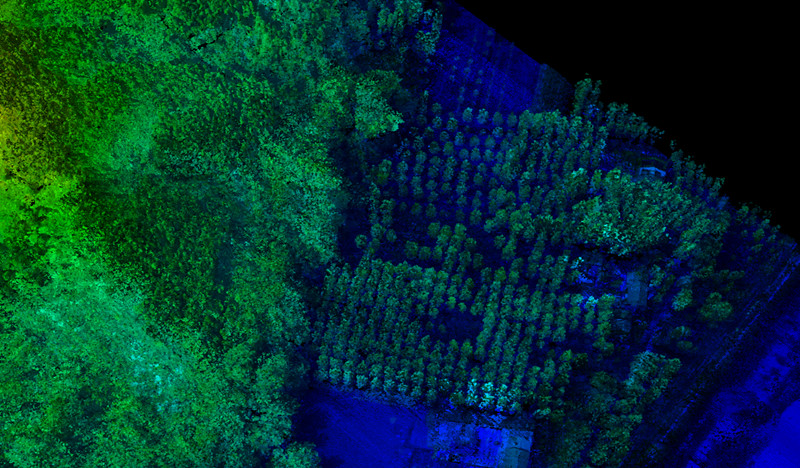
Forestry Management
For forests, point cloud data creates detailed 3D models. It can see the trees, the little plants below, and even the ground. This is a game-changer for managing forests. We can monitor their health, plan when to cut down trees for timber, and spot places that need replanting. It's like giving forests a health checkup.
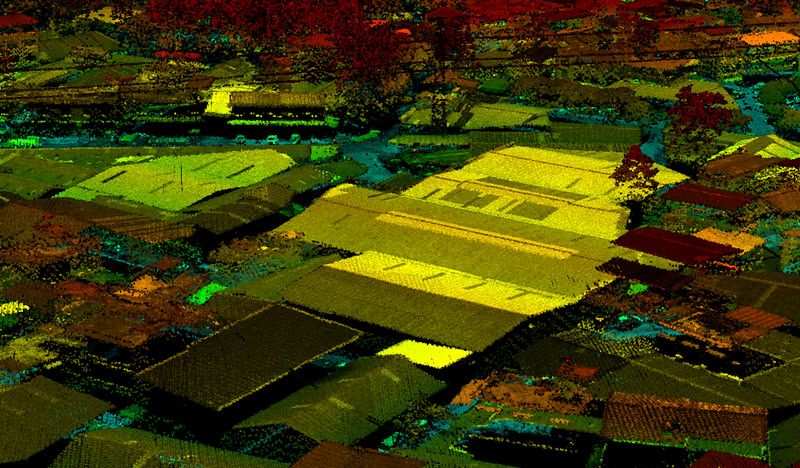
Urban Planning
In cities, point cloud data makes 3D models of buildings, roads, and everything else. It tells us where things are and how tall they are. This helps with planning how cities grow, and it's like having a blueprint for urban areas. We can also spot places that need fixing or improving. It's like being a city detective with a super-precise 3D magnifying glass.
What is the Difference Between LiDAR Data and Point Cloud?
LiDAR, which stands for Light Detection and Ranging, is a technology that plays a pivotal role in the creation of point clouds.
It operates by emitting laser pulses and measuring the time it takes for these pulses to bounce off surfaces and return to the sensor.
This precise method results in what we call "LiDAR data."
LiDAR data comprises accurate 3D spatial information, represented as a set of coordinates in space. It does not inherently contain color information (RGB values).
Instead, it excels in capturing the geometry, making it the go-to choice when pinpoint accuracy is a necessity.
A point cloud, on the other hand, is the digital representation of the spatial data collected through LiDAR or other means.
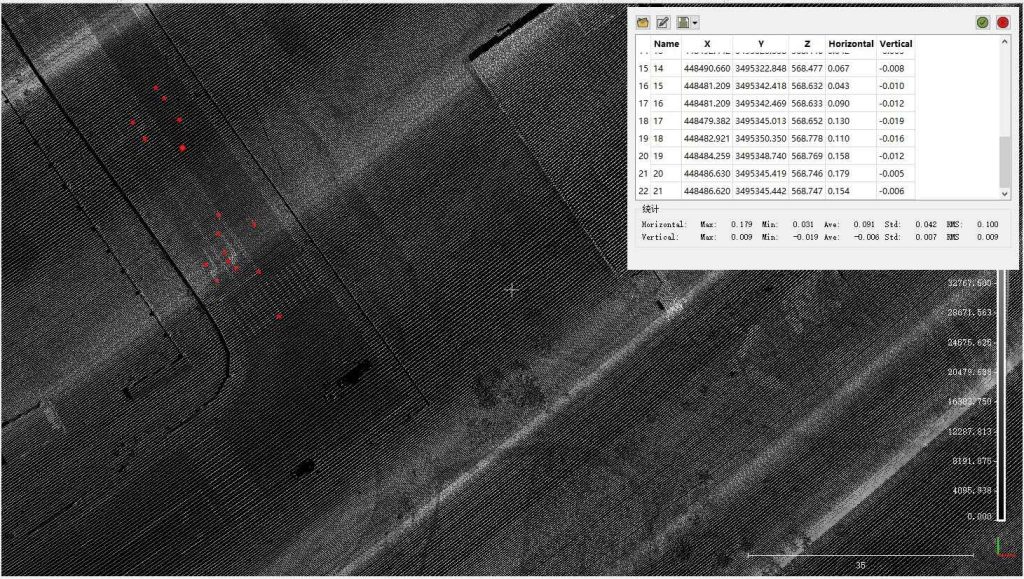
The CW-25E was equipped with JoLiDAR-LR22S, which captured precise, high-density original point cloud data with remarkable vertical accuracy of up to 0.9 centimeters. Importantly, this was achieved without the necessity of ground control points (GCPs).
While LiDAR is a prominent method for creating point clouds, it's important to note that not all point clouds are derived from LiDAR technology.
Point clouds can also be generated through photogrammetry, a process that utilizes images captured by digital cameras.
The defining characteristic that distinguishes photogrammetric point clouds from LiDAR-derived ones is the inclusion of RGB values for each point.
This gives rise to colorized point clouds, enhancing the visual representation of the scanned environment.
However, when it comes to pinpoint accuracy, LiDAR remains unrivaled.
It excels in scenarios where precision is paramount, such as topographic mapping, forestry management, or urban planning.
- Read more: LiDAR vs Photogrammetry: The Ultimate Showdown for 3D Mapping
What Type of Equipment Would be Used to Collect Point Cloud Data?
Collecting point cloud data involves using specialized equipment and sensors to capture detailed spatial information. Here are some common types of equipment used to collect point cloud data:
LiDAR Scanners
- Terrestrial LiDAR Scanners: These scanners are mounted on tripods or vehicles and can capture high-resolution point clouds of objects or scenes from the ground level. They are commonly used in applications such as surveying, engineering, and archaeology.
- Mobile LiDAR Systems: Mounted on vehicles, boats, or drones, these systems can capture 3D data of large areas quickly and efficiently. They are often used for mapping roads, railways, and urban environments.
- Airborne LiDAR Systems: These systems are mounted on aircraft and are used for capturing extensive geographical areas such as forests, mountains, and large infrastructure projects. Airborne LiDAR is widely utilized in forestry management, terrain modeling, and floodplain mapping.

CW-25E VTOL drone with JoLiDAR-LR22S
Photogrammetric Cameras
- Aerial Cameras: These specialized cameras are mounted on airplanes or drones to capture high-resolution images of the Earth's surface. These images can be processed using photogrammetry techniques to create detailed and accurate 3D point clouds.
- Ground Cameras: Digital cameras mounted on tripods or handheld devices can capture images of objects or scenes from various angles. When multiple images are combined using photogrammetry software, they can generate detailed point clouds.
Global Navigation Satellite Systems (GNSS)
GNSS receivers, including GPS (Global Positioning System) and GNSS augmentation systems like RTK (Real-Time Kinematic), provide accurate positioning data for LiDAR scanners and photogrammetric cameras. This ensures precise georeferencing of the captured point cloud data.
Inertial Measurement Units (IMUs)
IMUs are sensors that measure a specific force, angular rate, and sometimes the magnetic field surrounding the sensor. Integrated with LiDAR scanners or cameras, IMUs help compensate for movements and vibrations during data capture, ensuring the accuracy of the collected data.
Unmanned Aerial Vehicles (UAVs or Drones)
UAVs with LiDAR sensors or high-resolution cameras are increasingly popular for aerial surveys and mapping tasks. They can access challenging or remote environments and capture data more quickly and cost-effectively than traditional methods.
The CW-15 Drone LiDAR system, equipped with the JoLiDAR-1000, is a cutting-edge solution for point cloud data collection. Its impressive flight time of 80-90 minutes, a range of 50 km, and effective operating area of up to 18 km² make it incredibly efficient. With a point cloud density of 183 points per square meter and vertical accuracy as low as 2-3 cm, it ensures detailed and precise data capture.
How is Point Cloud Captured?
Obtaining point cloud data is a sophisticated process that requires a combination of advanced technologies, specialized equipment, and meticulous data processing methods. Let's delve into a more comprehensive and detailed explanation:
1. LiDAR Data Acquisition
Imagine LiDAR as a high-tech laser rangefinder. It all starts with a LiDAR system, which emits rapid laser pulses in different directions, covering the area of interest. When these laser pulses travel through the air, they don't just disappear into thin air. They hit objects, surfaces, or trees, and when they do, a portion of the laser light bounces back to the LiDAR sensor.
Now, the LiDAR sensor is pretty clever. It measures the time it takes for the laser pulse to travel to the object and bounce back. Since we know the speed of light, we can calculate the distance from the sensor to the object. This distance becomes a point in the point cloud, complete with XYZ coordinates.
But here's the kicker: LiDAR doesn't send just one pulse; it sends a whole bunch of them really fast. We're talking hundreds of thousands to millions of pulses per second! The sensor rapidly scans the area, and all these distance measurements are combined to create a detailed 3D point cloud.
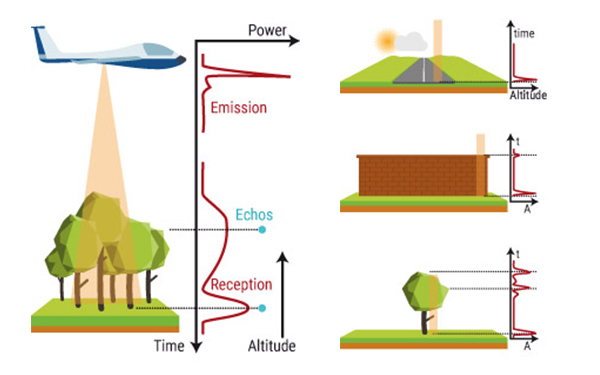
How does LiDAR work? Source from Yellowscan
2. Photogrammetric Data Acquisition
Photogrammetry is like turning a bunch of photographs into a 3D model. You start by capturing a bunch of images of a scene from different angles using digital cameras. The more images, the better.
Specialized photogrammetry software plays detective. It spots common features in these images, like recognizable corners or edges, and uses these features to figure out where objects are in 3D space. The software then calculates the 3D position of every point in the scene by triangulating info from multiple images. This magic trick results in a 3D point cloud, with each point having XYZ coordinates.
3. Data Integration
In photogrammetry, we go one step further. Each point in the point cloud gets its own RGB color value. How? By matching the 3D points to the pixels in the images. This jazzes up the point cloud with colors, making it more visually appealing.
Also, in both LiDAR and photogrammetry, we can add more info to each point. Think of it as giving each point a little ID badge. This can include stuff like how reflective the surface is (intensity) or what kind of thing it is (classification, like ground, trees, buildings, etc.).
How to View Point Cloud Data?
Once point cloud data is captured, the next challenge is how to effectively view and navigate this intricate 3D representation. To do this, you'll need specialized software and, sometimes, a computer with decent processing power.
1. Choose the Right Software
Start by selecting the right software for the job. There are various options available, and the choice often depends on your specific needs and the type of point cloud data you're working with. Some popular software packages for viewing point clouds include:
- JoLiDAR: JoLiDAR is an all-in-one point cloud post-processing software that not only allows you to view point clouds but also offers comprehensive tools for editing, cleaning, and analyzing data. It's an excellent choice for those looking for a complete solution.
JoLiDAR point cloud post-processing software
- CloudCompare: This open-source software is user-friendly and supports various point cloud formats. It's a good choice for basic viewing and simple editing.
- Potree: A web-based point cloud viewer that allows you to view point clouds directly in your web browser. It's excellent for sharing point cloud data online.
- AutoCAD: If you're in the field of architecture or engineering, AutoCAD offers tools for viewing and working with point clouds, making it suitable for those industries.
- 3D Modeling Software: Programs like Blender, Rhino, or Autodesk Maya can also be used to viewpoint cloud data when integrated with appropriate plugins or extensions.
2. Import Your Point Cloud
Once you've chosen your software, import your point cloud data into the program. Most software packages support various point cloud file formats, such as.LAS, .XYZ, or.PLY. You'll typically find an "import" or "open" option to load your data.
3. Navigation
After you've imported your point cloud, you'll usually find yourself looking at a complex 3D scene. You can navigate through this scene to view the data from different angles. Common navigation tools include:
- Mouse Controls: You can often rotate the view by clicking and dragging the mouse, zoom in and out using the scroll wheel, and pan the view by holding down specific mouse buttons.
- Keyboard Shortcuts: Some software packages use keyboard shortcuts for navigation. For example, you might use arrow keys to move around.
- On-Screen Tools: Look for on-screen buttons or controls that allow you to manipulate the view.
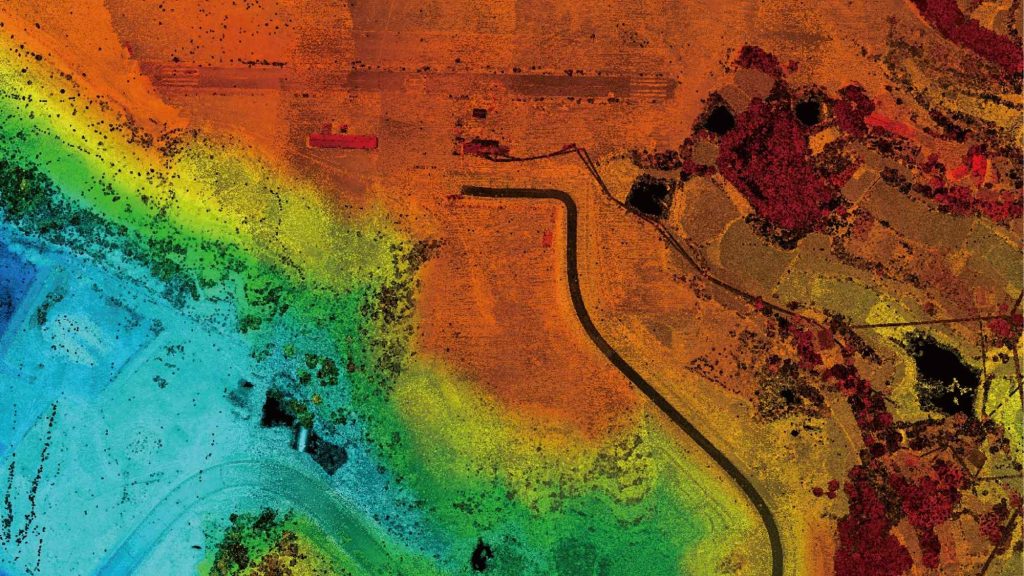
4. Data Visualization
To get the most out of your point cloud, you can adjust its visualization settings. This includes changing the color of the points, adjusting the point size, and sometimes even adding realistic color using images or intensity values. These options help you see the data more clearly.
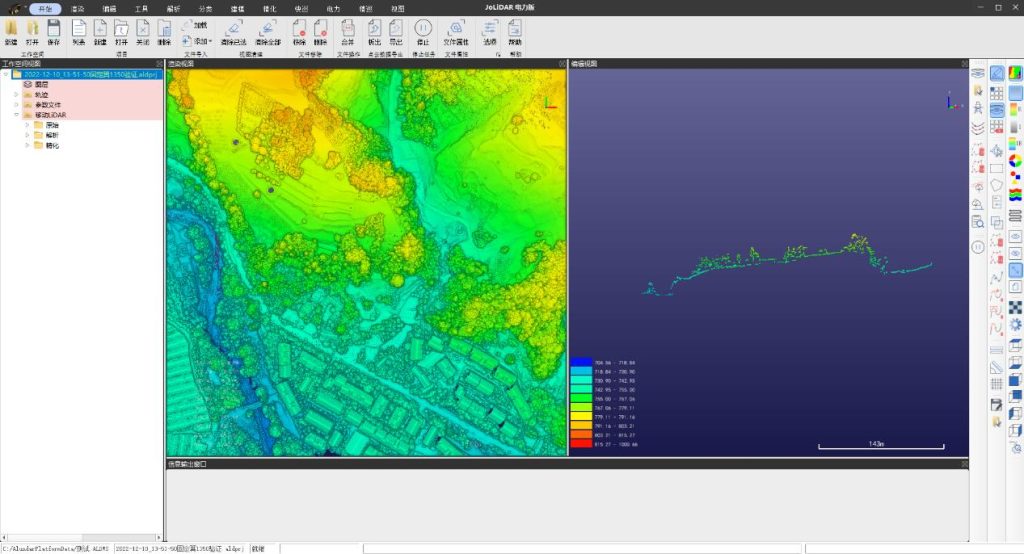
View LiDAR point cloud data in JoLiDAR software
How to Process Point Cloud Data?
Raw point cloud data often requires post-processing to refine and enhance its utility. It involves several essential actions to make sense of the vast amount of data collected.
1. Cleaning and Filtering
Imagine LiDAR data as a treasure trove of information, but it can be a bit messy. This step is like separating the gems from the pebbles. LiDAR data can be noisy, and filled with erroneous or unnecessary points. To boost accuracy, we need to clean it up or normalize it:
- Establish a Reference Plane: First, we need to decide on a reference plane. This is like choosing a standard level from which all measurements will be made. It could be the ground, a specific floor in a building, or any other stable surface.
- Identify Ground Points: In most cases, the actual ground serves as the reference plane. So, we identify points in the point cloud data that represent the ground level. These are often the lowest points in the data set.
- Calculate Differences: We calculate the height differences between the ground points and the reference plane. For points above the ground, this difference will be positive, and for points below, it will be negative.
- Adjust Point Heights: Now, we adjust the heights of all points in the point cloud based on these calculated differences. Points above the reference plane are lowered by subtracting their height difference, and points below are raised by adding their height difference.
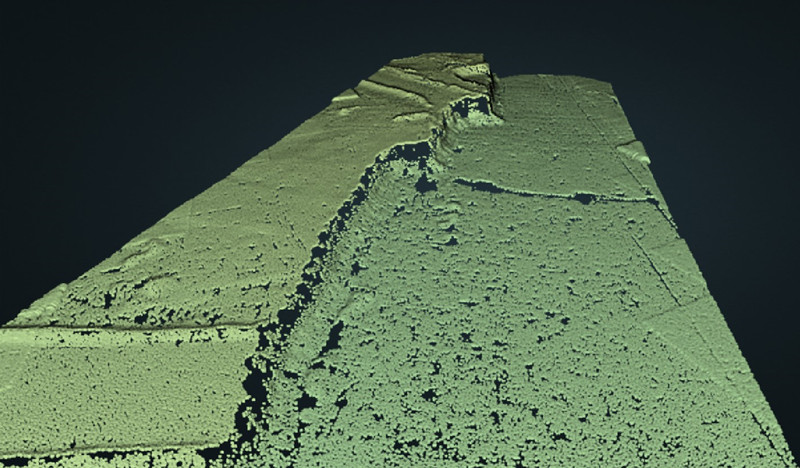
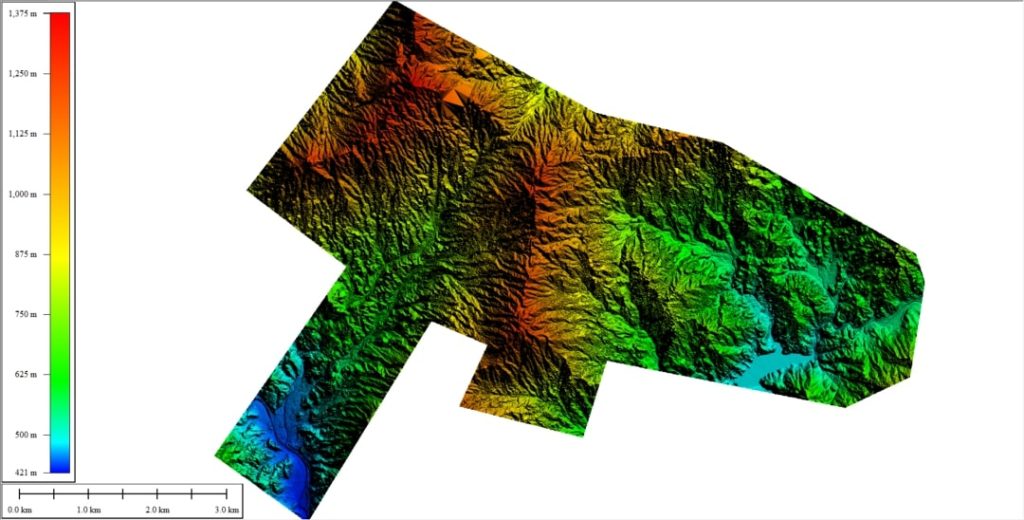
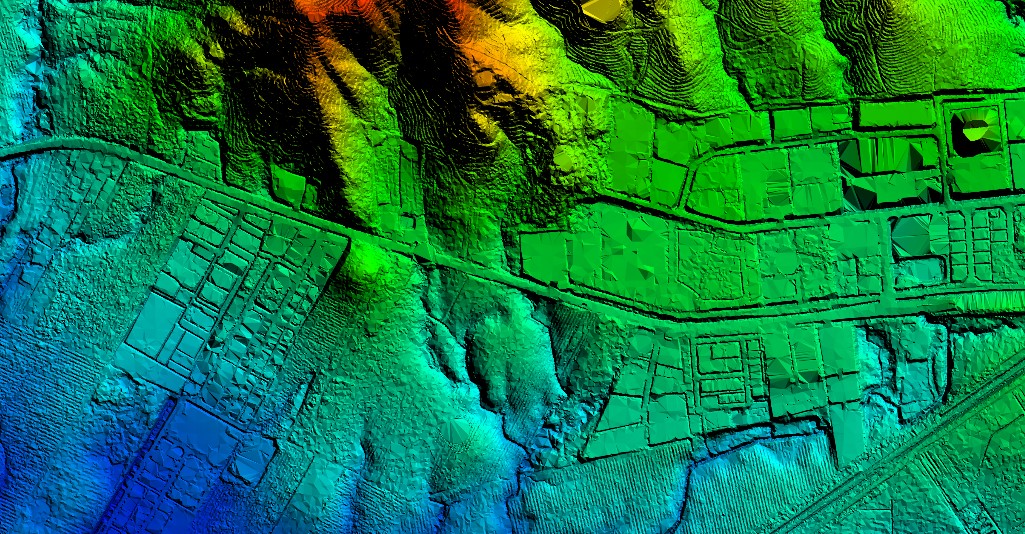
2. Generating DEMs and DSMs
Now that we have a clean dataset, it's time to create something useful. This involves generating Digital Elevation Models (DEMs) and Digital Surface Models (DSMs). Think of a DEM as a 3D map of the terrain, showing the elevation of the ground at each point in the point cloud.
A DSM, on the other hand, is a 3D map of the Earth's surface, including the terrain and any objects on it (like buildings and trees). Both DEMs and DSMs are like the maps we use but in 3D. They're versatile and can be used for a bunch of things, from predicting floods to managing forests.
The CW-15 VTOL UAV, equipped with the JoLiDAR-120 system, gathered point cloud data with a 1:2000 scale at the wind farm site in Fengxin County, located in the northwestern part of Jiangxi Province, China. The survey area has an average point density of approximately 30%.
3. Point Classification
Here, we sort the LiDAR points into different categories. For example, we can classify points as ground points (the Earth's surface) or non-ground points (like trees, buildings, or even birds flying by).
Why do this? Well, it's super handy for applications that need to know the difference between the ground and other stuff on the surface, such as creating detailed surface models.
How to Save a Point Cloud Data?
Saving and storing point cloud data, especially when dealing with terabytes of information, is a crucial aspect of LiDAR surveying. Let's break it down in a way that's easy to understand:
1. File Formats Matter
Your point cloud data is usually saved in specific file formats like XYZ, OBJ (with some proprietary binary exceptions), PTX (Leica), ASC, LAS, LAZ, or E57. These formats are like the language your computer understands for point clouds. They organize the data and make it easy to access when you need it.
2. Organize and Index Your Data
Just like you organize your files into folders on your computer, you should organize or index your point cloud data:
- Data Segmentation: First, the entire point cloud is broken down into smaller chunks or segments. These segments can represent specific areas, objects, or features within the scanned environment. Each segment contains a subset of the point cloud data.
- Feature Extraction: Within each segment, relevant features are identified and extracted. These features can include key points, edges, or other distinctive elements in the point cloud. Extracting these features is crucial for efficient indexing.
- Attribute Association: Associated attributes, such as RGB values for color or intensity values, are linked to the extracted features. This association enhances the visual representation of the indexed data.
- Hierarchical Structuring: The indexed data is often structured hierarchically. This means organizing segments and features in a tree-like structure, where larger segments contain smaller sub-segments, and features are organized within their respective segments. This hierarchical arrangement improves the efficiency of searching and retrieval.
- Spatial Indexing: Spatial indexing techniques, such as octrees or k-d trees, are applied to the segmented data. These structures organize the 3D space efficiently, enabling quick spatial queries. Spatial indexing optimizes data retrieval based on the proximity of points in space.
3. Backup, Backup, Backup
You're dealing with a lot of data, and losing it would be a disaster. That's why you should have a solid backup plan. Consider using external hard drives, network-attached storage (NAS), or cloud storage services to create duplicate copies of your data.
4. Metadata Matters
Metadata is like the information tags you put on your photos. It includes details about when and where the data was captured, what equipment was used, and any other critical information. This helps you understand and use your data effectively.
5. Data Compression for Efficiency
Dealing with terabytes of data can be daunting. Compression can be a real help. Formats like LAZ use compression to save space without sacrificing data quality. It's like fitting your data into a smaller suitcase.
6. Data Management Software
Specialized software can be a lifesaver. It helps you manage and view your point cloud data efficiently. It's like having a librarian who keeps your data organized and accessible.
7. Archiving for the Long Term
As you keep collecting more and more data, you might want to archive older data onto long-term storage solutions like tapes. It's like putting your data in a digital library for safekeeping, freeing up space on your main storage.
8. Data Security
Last but not least, remember that your data can be valuable and sensitive. So, think about keeping it secure with measures like encryption and access controls. It's like putting a lock on the door to protect your valuable possessions.
How to Convert Point Cloud to 3D Model?
Converting a point cloud to a 3D model might sound complex, but let me break it down in a simple and natural way for you:
1. Point Cloud Preparation
First, you need a clean and organized point cloud. This may involve removing any noisy or irrelevant data points and ensuring that all the points are properly aligned and formatted.
2. Surface Reconstruction
To create a mesh, you need to figure out how to connect the points to form surfaces. This is where surface reconstruction algorithms come into play. They analyze the point cloud and create triangles (or other shapes) to connect the points, forming a surface.
3. Mesh Generation
Once the surfaces are created, they are stitched together to form a complete mesh. This mesh consists of triangles that connect the points in a way that represents the shape and contours of the scanned object or environment.
4. Texturing (Optional)
If your point cloud has color information (like from photogrammetry), you can add texture to your 3D model. This step gives your model a realistic appearance with colors and details.
5. Mesh Refinement (Optional)
Depending on the application, you might need to refine the mesh. This can involve smoothing out irregularities, filling holes, or reducing the level of detail to optimize it for a specific use case.
6. Export Your 3D Model
Finally, once you're satisfied with your 3D model, you can export it in a common 3D file format such as.OBJ or.STL. These formats can be easily used in various applications, including 3D printing, simulations, or architectural visualizations.
How to Convert a 3D Point Cloud Data to 2D Map?
While 3D models are incredibly valuable, there are scenarios where a 2D representation, like a map, is more practical and accessible. Here's how it's done in a straightforward way:
1. Understanding the Point Cloud
First off, you have your detailed 3D point cloud data. Each point in the cloud has its own XYZ coordinates, capturing the object or landscape in 3D space.
2. Projection onto a 2D Plane
To create a 2D map, we need to project these 3D points onto a flat, 2D plane. This process is called orthographic projection. Imagine shining a light from above and capturing the shadows of these points on the ground.
3. Coordinate Transformation
To make this projection, we use complex math to transform the 3D coordinates into 2D coordinates. Think of it as translating the depth (Z-axis) into shades of grey (or any color) on a 2D image.
4. Creating the 2D Image
Now, we have a set of 2D points that represent the 3D scene on a flat surface. Combining all these points results in a 2D image, which essentially is your map.
5. Color Mapping (Optional)
If your point cloud contains RGB values (color information), these can be mapped onto the 2D points as well, adding visual detail to your map.
6. Finalizing the Map
Post-processing steps might include filtering out unnecessary points, adjusting colors for better visibility, and adding labels or other contextual information.
Read More


Every drone needs a brain.
Without it, you’re holding an expensive paperweight with spinning blades.
That brain is called a flight controller—but most people have no idea what it actually does.

Let’s be honest: the drone world loves its acronyms. UAV, UAS, drone, RPAS, UCAV, FPV–it’s an alphabet soup. And most people use them like they’re the same thing.
They’re not.
And here’s why that matt

JOUAV Product News and Use Cases
Fixed-Wing VTOL Drones Insights and Industry Trends
Invitations to online demo events