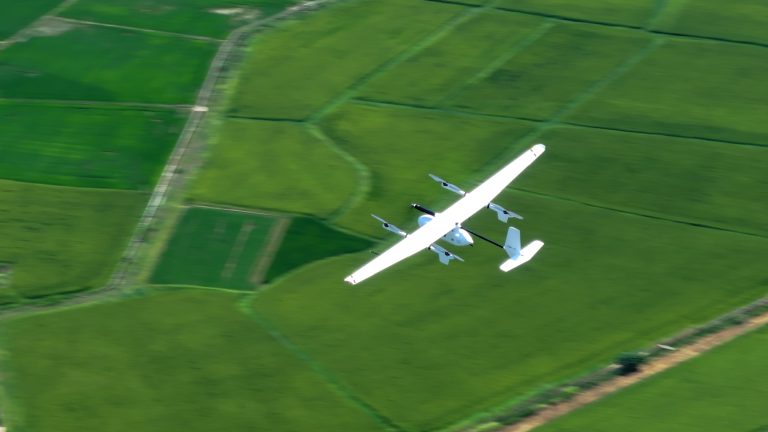
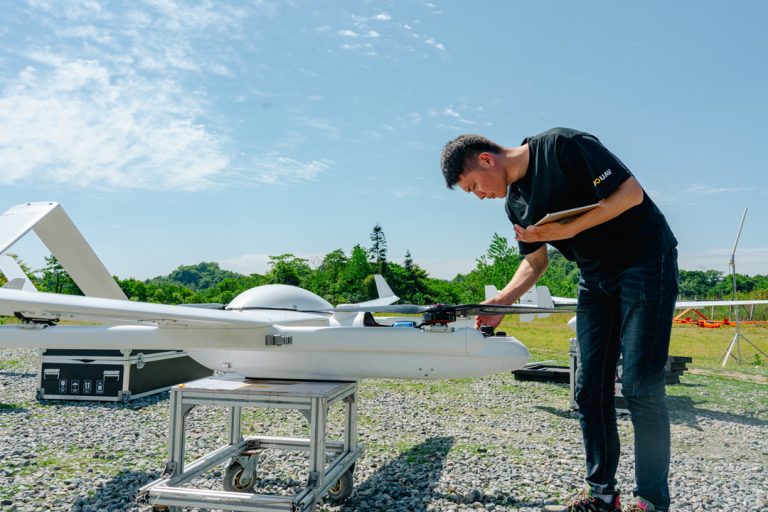
A raw LiDAR point cloud may already reveal roads, buildings, and vegetation in remarkable detail. But visual clarity does not necessarily mean the data is ready for surveying or engineering applications. The point cloud may still require trajectory correction, georeferencing, strip alignment, and classification before it can support reliable measurements.

LiDAR data processing transforms raw laser measurements into accurate, structured, and usable spatial data. The result may include a classified point cloud, digital elevation models (DEMs), terrain models, and extracted features such as buildings or power lines.

This guide explains the complete LiDAR data processing workflow, from raw data preparation and trajectory processing to point cloud classification and 3D modeling. It also covers common processing techniques, software tools, service options, costs, and the specific considerations involved in drone LiDAR data processing.
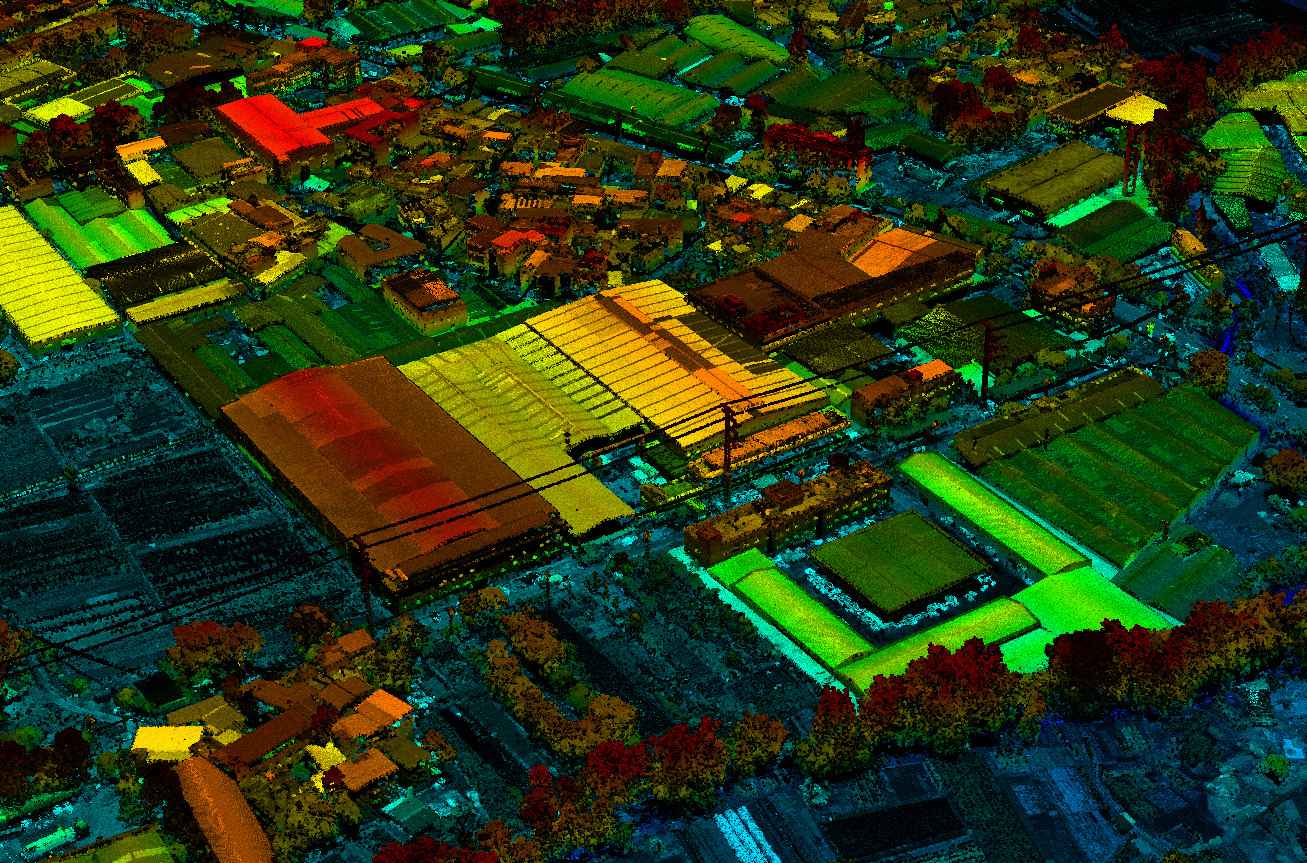
LiDAR 3D point cloud showing terrain and surface features

What Is LiDAR Data Processing?

What Is LiDAR Data Processing?

LiDAR data processing is the process of converting raw laser measurements and positioning data into georeferenced point clouds and other spatial products. It involves correcting the position of each measured point, removing unwanted data, identifying the features represented by the points, and generating outputs suitable for a specific project.

The main processing tasks fall into four groups:

  • Data preparation and trajectory processing: Check the raw files, synchronize sensor data, and calculate the scanner's position and orientation.

  • Point cloud generation and alignment: Convert laser measurements into georeferenced XYZ coordinates and align overlapping scans or flight strips.

  • Point cloud cleaning and classification: Remove noise and assign points to classes such as ground, vegetation, buildings, and water.

  • Modeling and data export: Generate elevation models, contours, cross sections, and other project-specific deliverables.

Step line extraction JoLiDAR

The exact workflow depends on the LiDAR sensor, collection platform, data quality, and intended use. A drone survey, for example, requires careful GNSS/IMU trajectory processing and flight-strip adjustment, while mobile mapping may rely more heavily on SLAM and scan registration.

Raw LiDAR Data vs. Processed LiDAR Data

The term raw LiDAR data can refer to different stages of a project. It is important to distinguish sensor-level measurements from a preliminary point cloud that has already undergone some processing.

Data typeWhat it containsWhat remains to be done
Sensor-level raw dataLaser measurements, scan angles, timestamps, and GNSS/IMU observationsTrajectory processing, georeferencing, alignment, filtering, and classification
Preliminary point cloudAn initial georeferenced cloud, often generated shortly after data collectionQuality checks, trajectory refinement, strip adjustment, detailed classification, and accuracy assessment
Processed LiDAR dataA cleaned, georeferenced, and quality-checked point cloud, often with classification and derived productsAdditional editing or analysis may still be needed for a particular application

A preliminary cloud can help a field crew check survey coverage, but it should not automatically be treated as a final deliverable. Its accuracy, coordinate reference system, processing status, and classification may not yet meet the project requirements.

When purchasing or outsourcing LiDAR data processing, confirm exactly which data stage is included in the quoted scope.

What Are the Main Deliverables of LiDAR Data Processing?

Processed LiDAR data can be used to generate several types of spatial products. The required deliverables depend on the project specification and intended application.

DeliverableDescriptionTypical applications
Classified point cloud3D points labeled by feature type, such as ground, vegetation, buildings, or waterMapping, feature extraction, and further analysis
Digital Elevation Model (DEM)A raster representation of elevation; the exact surface represented should be defined in the project specificationElevation mapping and terrain analysis
Digital Terrain Model (DTM)A representation of the bare-earth terrain, with vegetation and structures removedTopographic surveying, drainage, and land development
Digital Surface Model (DSM)A representation of the upper surface, including buildings, vegetation, and other objectsUrban modeling, vegetation analysis, and visibility studies
Canopy Height Model (CHM)A model of vegetation height, commonly derived by subtracting the DTM from the DSMForestry and vegetation management
Contours and breaklinesElevation lines and 3D vectors representing terrain features or surface discontinuitiesCivil engineering and land development
Cross sectionsVertical profiles along a defined alignmentRoad, rail, river, and pipeline projects
Feature layersExtracted objects such as buildings, poles, conductors, and road featuresUtility inspection and asset management

Note: DEM is sometimes used as a general term for elevation models and sometimes as a synonym for a bare-earth model. Always define the required surface in the project specification rather than relying on the acronym alone. Engineering applications may also require additional processing, such as breakline integration and hydro-enforcement, to meet design requirements.

LiDAR Data Processing Workflow: 7 Steps

LiDAR Data Processing Workflow: 7 Steps

A typical LiDAR data processing workflow includes seven steps. The first four establish the geometric quality of the point cloud. The remaining steps prepare the data for classification, analysis, and delivery.

Step 1: Review and Prepare Raw LiDAR Data

Before processing begins, check the completeness and quality of the collected data. Problems with missing files, incorrect timestamps, or calibration settings can affect every subsequent step.
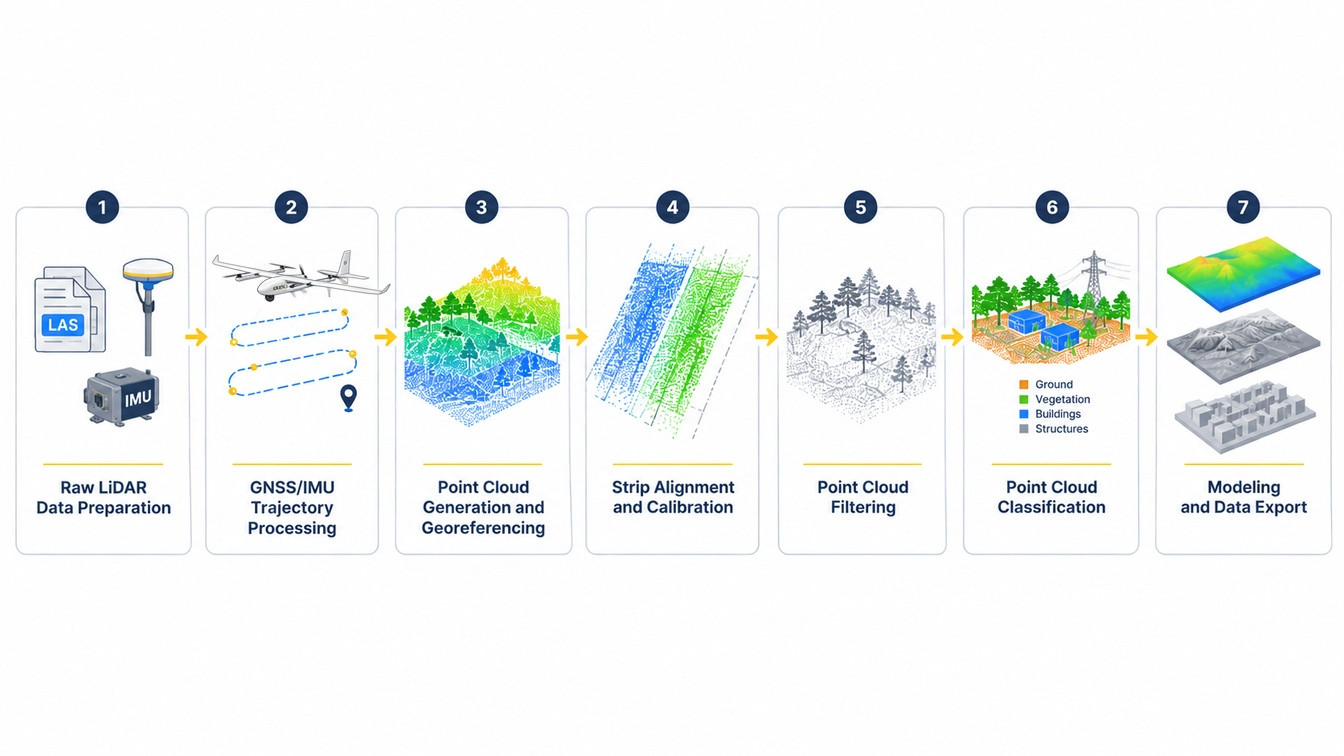
Seven-step LiDAR data processing workflow

Key checks include:

  • File integrity: Confirm that all flight lines or scan files are present and that files are readable and complete.

  • Time synchronization: Verify that the GNSS, IMU, and laser scanner timestamps use a consistent time reference.

  • GNSS reference data: Check the availability and quality of base station observations, where required, and confirm that station coordinates are correctly defined.

  • Sensor calibration: Verify the lever arm and boresight calibration values for the actual sensor installation.

  • Coverage and overlap: Confirm that the survey covers the project area and that overlapping strips provide enough common surface information for alignment.

  • Coordinate information: Identify the intended horizontal coordinate reference system, vertical datum, and height reference before processing.

The purpose of this review is to identify data problems early, before they become difficult to diagnose in the final point cloud.

Step 2: Process GNSS/IMU Trajectory Data

Trajectory processing determines the LiDAR scanner's position and orientation at each measurement time. It is particularly important for airborne and mobile LiDAR systems because the platform is moving while the scanner collects data.

GNSS provides positioning information, while the IMU measures the platform's acceleration and angular motion. Their observations are integrated to calculate a time-tagged trajectory containing position and attitude information.

Depending on the system and project requirements, the trajectory may be calculated using real-time kinematic positioning (RTK), post-processed kinematic positioning (PPK), or a vendor-specific POS processing workflow.

PPK vs. RTK

  • RTK applies GNSS corrections in real time, typically through a radio or network connection.

  • PPK applies corrections after data collection using recorded GNSS observations from the rover and a reference station.

PPK is often useful when real-time correction links are unreliable or unavailable. RTK can also be suitable when the correction link and survey conditions support the required accuracy. Some workflows use real-time positioning for field checks and post-processing for final data production.

The choice should depend on the equipment, GNSS conditions, reference data, and project accuracy requirements rather than a universal rule that one method is always preferable.

Trajectory quality has a direct effect on point cloud geometry. Small attitude errors can produce larger positional offsets as the distance between the scanner and the measured surface increases. This makes trajectory inspection an important part of diagnosing strip mismatches and accuracy problems.

Useful checks include reviewing trajectory quality statistics, examining GNSS availability throughout the survey, and comparing forward and reverse processing solutions when the system supports them.

Step 3: Generate and Georeference the Point Cloud

Once the trajectory has been calculated, the laser measurements can be transformed into 3D coordinates.

The process combines the measured range and scan angle with the scanner's position, platform attitude, and sensor mounting parameters to calculate the XYZ coordinates of each return.

Several factors need to be handled correctly:

  • Lever arm and boresight calibration: The lever arm describes the positional offset between the GNSS/IMU reference point and the laser scanner. Boresight calibration defines their angular relationship. Incorrect values can create systematic offsets between overlapping strips.

  • Coordinate reference system: The project must use the specified horizontal coordinate system, datum, and relevant coordinate epoch.

  • Vertical reference: Confirm whether elevations are ellipsoidal or orthometric. If orthometric heights are required, use the appropriate geoid model and document it.

  • Return information: Preserve first, last, and intermediate returns when they are needed for vegetation analysis or other applications involving multiple returns.

At the end of this step, the measurements form a georeferenced point cloud. However, the cloud may still contain inconsistencies between overlapping scans or flight strips.

Step 4: Perform Strip Alignment and Calibration

When a LiDAR survey is collected using overlapping flight lines, the same surface may be measured several times. Small differences in trajectory, sensor calibration, or positioning can cause these overlapping strips to appear slightly displaced.

Strip adjustment reduces these inconsistencies and improves the internal alignment of the point cloud.

A typical process includes two related operations:

  1. Relative strip adjustment: Identify common features or surfaces in overlapping strips and minimize their geometric differences. Planar surfaces such as roads, roofs, and open ground can provide useful matching areas.

  2. Absolute referencing: Where required, use surveyed ground control to constrain the point cloud to the project's coordinate framework and reduce remaining systematic offsets.

Accuracy must then be assessed independently. Ground control points used to adjust the data should not also be treated as independent checkpoints. Separate checkpoints should be used to evaluate the final horizontal and vertical accuracy.

Useful quality indicators include strip-to-strip differences, adjustment residuals, and errors at independent checkpoints. The residual pattern can also help identify the source of a problem: systematic differences along flight lines may indicate trajectory or calibration issues, while localized differences may come from surface changes or unsuitable matching areas.

Step 5: Filter and Clean the Point Cloud

Point cloud filtering removes unwanted measurements and artifacts that do not represent reliable surface information. It is different from ground classification: filtering focuses on data quality, while classification identifies what the remaining points represent.

Common unwanted points include:

Type

Cause

Low points

Multi-path returns, dark or absorptive surfaces, sensor noise

High flyers

Birds, aircraft, dust, rain or snow in the beam path

Edge-of-scan artifacts

Beam divergence and weak returns at maximum range or steep incidence

Sub-surface points

Water and glass, where the pulse penetrates or scatters before returning

Moving objects

Vehicles, people, machinery, swaying vegetation

Ghost surfaces

Reflections from wet pavement, windows, or metal roofs

Filtering methods should be selected according to point density, terrain, and the type of noise present. Applying aggressive filters without reviewing their effects can remove valid features, especially in areas with sparse points or complex terrain.

Ground filtering should be treated as a separate classification task. A filter designed for open, flat terrain may not perform well around steep slopes, rocks, low vegetation, or retaining walls.

Step 6: Classify Points and Extract Features

Point cloud classification assigns labels to individual points according to the objects or surfaces they represent. This makes the data easier to analyze and allows specific products, such as bare-earth terrain models, to be generated.
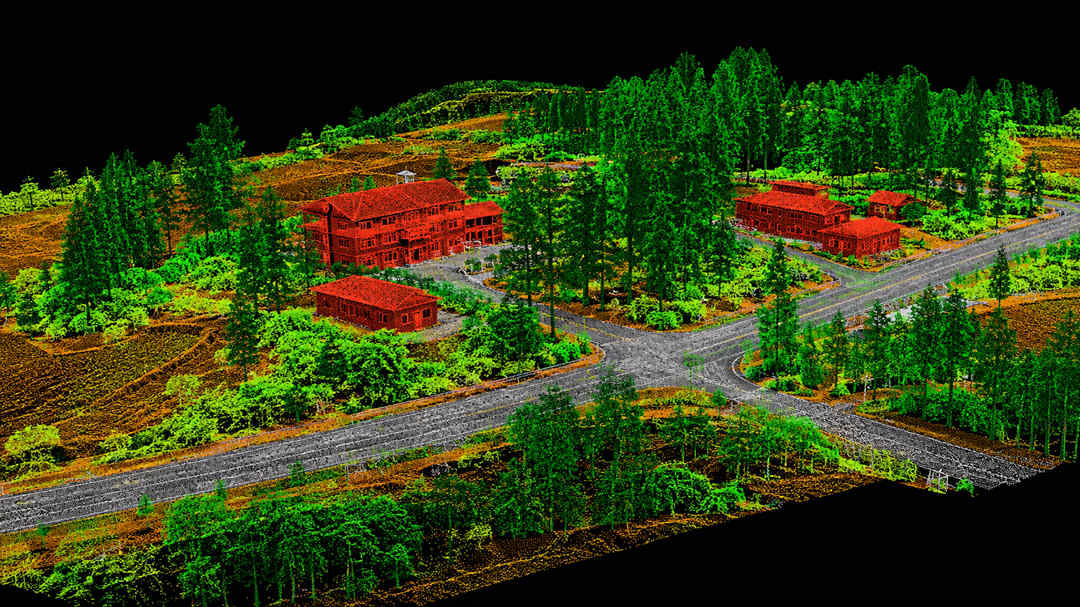
LiDAR point cloud classification showing ground vegetation and buildings

Many projects use the ASPRS LAS classification scheme, although the required classes should always follow the project specification and the applicable LAS version.

Common class codes include:

Class

Meaning

Notes

1

Unclassified

Everything not yet assigned

2

Ground

The class that drives DEM generation

3 / 4 / 5

Low / medium / high vegetation

Split by height; exact thresholds vary by spec

6

Building

Roof and wall returns

7

Low point (noise)

Below-ground artifacts

9

Water

Often left unclassified until hydro enforcement

10 / 11

Rail / road surface

Required for corridor and DOT work

17

Bridge deck

Kept out of the ground class so bridges don't dam the DEM

18

High noise

Above-ground artifacts

The exact classification requirements vary. A topographic survey may focus primarily on separating ground from non-ground points, while a power line inspection may require detailed identification of conductors, towers, and surrounding vegetation.

A typical classification process involves:

  1. Ground classification: Identify points representing the bare-earth surface.

  2. Above-ground classification: Separate vegetation, buildings, and other objects using geometric characteristics and height above ground.

  3. Targeted feature extraction: Identify specific assets such as power lines, poles, road edges, or building footprints.

  4. Manual review and editing: Check complex areas where automated classification may produce errors, including bridges, retaining walls, dense vegetation, and water boundaries.

  5. Quality validation: Review classification results against the project requirements and correct errors before generating final surfaces.

Automated classification can reduce manual work, but its performance varies with terrain, vegetation, point density, and sensor characteristics. Where classification accuracy is important, it should be assessed using appropriate reference data and class-level validation rather than relying on a single general accuracy percentage.

Step 7: Generate Models, Analyze Data, and Export Deliverables

Once the point cloud has been cleaned and classified, it can be used to create the required spatial products.

Common outputs include:

  • DEM or DTM: Generated from ground-class points using an appropriate interpolation method. Breaklines and hydro-enforcement may be needed for engineering or hydrological applications.

  • DSM: Generated from points representing the upper surface. The selection of returns and interpolation method should match the intended surface definition.
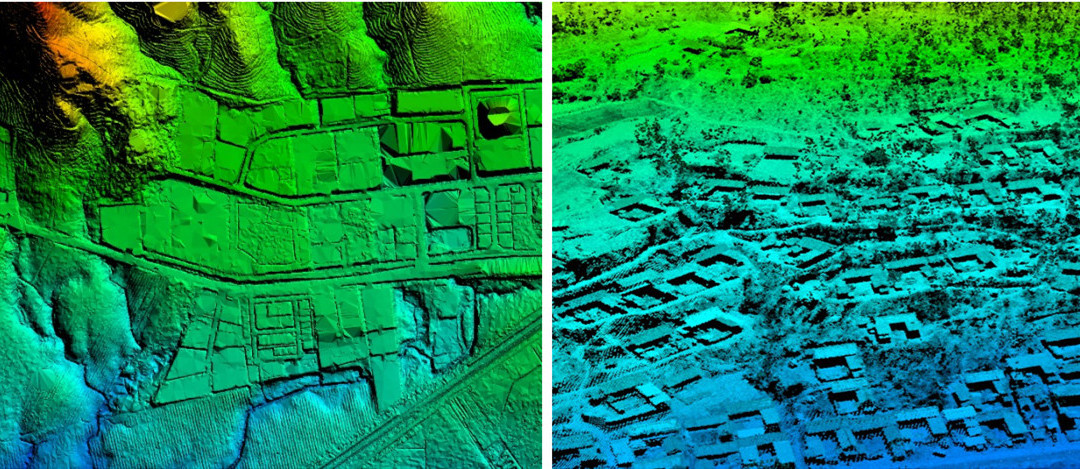
The difference between DSM, and DTM

  • TIN: Built from terrain points and, where required, breaklines to preserve important surface features.

  • Contours: Generated at the specified elevation interval and checked against the source surface.

  • Cross sections: Extracted along project alignments for design and measurement.

  • Volumes and measurements: Used for stockpile calculations, cut-and-fill analysis, clearance measurement, and other project-specific tasks.

The final export may include LAS/LAZ point clouds, GeoTIFF elevation rasters, GeoPackage or other vector formats, and CAD-compatible files, depending on the client's requirements.

Before delivery, perform a final quality check:

  • Compare point density with the project specification.

  • Assess horizontal and vertical accuracy using independent checkpoints.

  • Review strip consistency and adjustment residuals.

  • Inspect classified point clouds and derived surfaces for obvious errors.

  • Confirm that the coordinate reference system, vertical datum, and metadata are correct.

  • Verify that all required deliverables and file formats are included.

Different LiDAR Data Processing Techniques

Different LiDAR Data Processing Techniques

The workflow describes the order of processing. Techniques are the methods used within individual steps. Choosing the right method depends on the point cloud's characteristics, terrain, required accuracy, and available processing resources.

Point Cloud Filtering Techniques

Different filtering methods address different types of noise and point distribution.

TechniqueHow it worksBest suited for
Statistical outlier removalIdentifies points whose distances to neighboring points differ significantly from the local distributionRemoving isolated noise in relatively consistent point clouds
Radius-based filteringRemoves points with too few neighbors within a defined search radiusDetecting isolated points and sparse noise
Voxel-based downsamplingGroups points into 3D cells and reduces the number of points retainedReducing data volume before analysis or visualization
Terrain-adaptive filteringUses local terrain characteristics to distinguish ground from above-ground objectsGround extraction in varied terrain

Voxel downsampling is a density-reduction technique, not a noise-removal method. It should not be used as a substitute for filtering when the goal is to identify invalid measurements.

For projects with mixed terrain types, processing parameters may need to be adjusted by area. A single setting may not work equally well on open ground, steep slopes, and dense vegetation.

Point Cloud Classification Techniques

Classification methods range from simple rule-based approaches to machine learning and manual editing.

  • Rule-based classification: Uses characteristics such as height above ground, local surface variation, return information, and intensity. It is relatively easy to interpret and useful for standard classification tasks but may struggle with complex boundaries.

  • Machine learning: Uses training data and point attributes to identify different object types. It can handle more complex patterns but depends on the quality and relevance of the training data.

  • Deep learning: Models such as PointNet++ and RandLA-Net learn spatial features from point clouds. They can support more complex classification tasks but require suitable training data and computational resources.

  • Manual editing: Allows operators to review and correct difficult areas that automated methods may misclassify, such as bridges, water edges, and structures with unusual geometry.

Many production workflows combine automated classification with targeted manual review rather than relying entirely on one method.

Point Cloud Registration and Alignment Techniques

Registration methods align different point clouds or scans into a common coordinate frame.

  • Iterative Closest Point (ICP): Iteratively minimizes distances between corresponding points or surfaces. It is commonly used when the initial alignment is already reasonably close.

  • Feature-based registration: Uses distinctive geometric features to establish correspondences between scans. It can help when the initial positional difference is larger.

  • Surface or plane matching: Uses common planar surfaces in overlapping strips to estimate and reduce alignment differences. It is useful in airborne LiDAR strip adjustment.

  • Control-based adjustment: Uses surveyed control to constrain the point cloud to a known coordinate framework. Independent checkpoints should remain separate for accuracy assessment.

No registration method can compensate for every type of trajectory or calibration error. The method should be selected according to the source of the mismatch and the available reference information.

Surface Modeling and Feature Extraction

Surface modeling converts a point cloud into a continuous representation of the terrain or objects being measured.

Two common approaches are:

  • Triangulated Irregular Network (TIN): Connects selected points into triangles and can incorporate breaklines to preserve important terrain discontinuities.

  • Raster interpolation: Estimates elevation values on a regular grid. It is suitable for many terrain-analysis workflows, but the result depends on the interpolation method, grid resolution, and input point distribution.

Feature extraction focuses on identifying specific objects rather than simply generating a surface. Depending on the application, methods may include geometric segmentation, region growing, shape detection, or machine learning.

Drone LiDAR vs. Airborne and Mobile LiDAR Data Processing

Drone LiDAR vs. Airborne and Mobile LiDAR Data Processing

The processing chain is the same across platforms. What changes is the error budget and the point geometry — and therefore where the effort goes.

Factor

Drone LiDAR

Manned airborne LiDAR

Mobile LiDAR

Scanner height

50–300 m AGL

500–3,000 m AGL

1–5 m above ground

Positioning

GNSS/IMU, PPK standard

GNSS/IMU, often with integrated POS

GNSS/IMU, or SLAM indoors and under canopy

Dominant error source

Attitude and boresight

Trajectory drift over long lines

Trajectory drift, especially without GNSS

Swath and strips

Narrow; many strips per site

Wide; block structure with many overlaps

Continuous corridor, sub-maps

Critical processing step

Strip adjustment

Block adjustment and tiling

Registration and loop closure

Typical deliverables

High-density terrain, corridor assets, vegetation structure

Regional DEM/DSM, hydrography, forestry

Road surface, tunnels, facades, utilities

Drone LiDAR Data Processing

Drone LiDAR systems typically collect data at relatively low altitudes and cover smaller areas per flight than manned airborne systems. A survey may therefore contain multiple overlapping flight strips that need to be aligned carefully.

Several factors are particularly important:

  • GNSS/IMU trajectory quality: Position and attitude errors can affect the entire point cloud. RTK or PPK should be selected according to the system configuration and project requirements.

  • Strip adjustment: Overlapping strips need to be checked for geometric consistency before final surface generation.

  • Multiple returns: Return information can help capture vegetation structure and ground points beneath tree canopies. Intermediate returns should be retained when the application requires them.

  • Scan geometry: Field of view, scanning direction, flight height, and flight-line spacing affect point distribution and the capture of vertical features.

  • Ground classification: Vegetation, steep terrain, and man-made structures may require parameter adjustments and manual review.

Payload design also affects the information available during processing. For example, the JOUAV JoLiDAR-120G supports up to 15 returns per pulse and three-directional scanning, from forward tilt through vertical downward to backward tilt. These capabilities can provide additional observations of vegetation and vertical structures. The actual results still depend on flight parameters, target characteristics, and processing settings.

CW-15 equipped with JoLiDAR 120

JOUAV's CW-15 equipped with the JoLiDAR-120

For projects that require an integrated UAV LiDAR solution, explore the JOUAV LiDAR payload range.

Airborne LiDAR Data Processing

Manned airborne surveys are often used for large-area mapping projects. Their processing requirements are influenced by the number of flight lines, data volume, project specifications, and delivery scale.

Large datasets may require block-wide adjustment, data tiling, parallel processing, and consistent export settings. The processing workflow must also account for the project’s classification, point density, accuracy, and metadata requirements.

For projects following a formal specification, compliance checking is an important part of processing. For example, the USGS 3D Elevation Program uses its Lidar Base Specification to define requirements for data collection and deliverables. The applicable version and project-specific requirements should be confirmed before processing begins.

Mobile LiDAR Data Processing

Mobile LiDAR systems collect point clouds from moving vehicles, backpacks, or handheld platforms. Unlike airborne surveys, the data is often organized as continuous corridors or scan sequences.
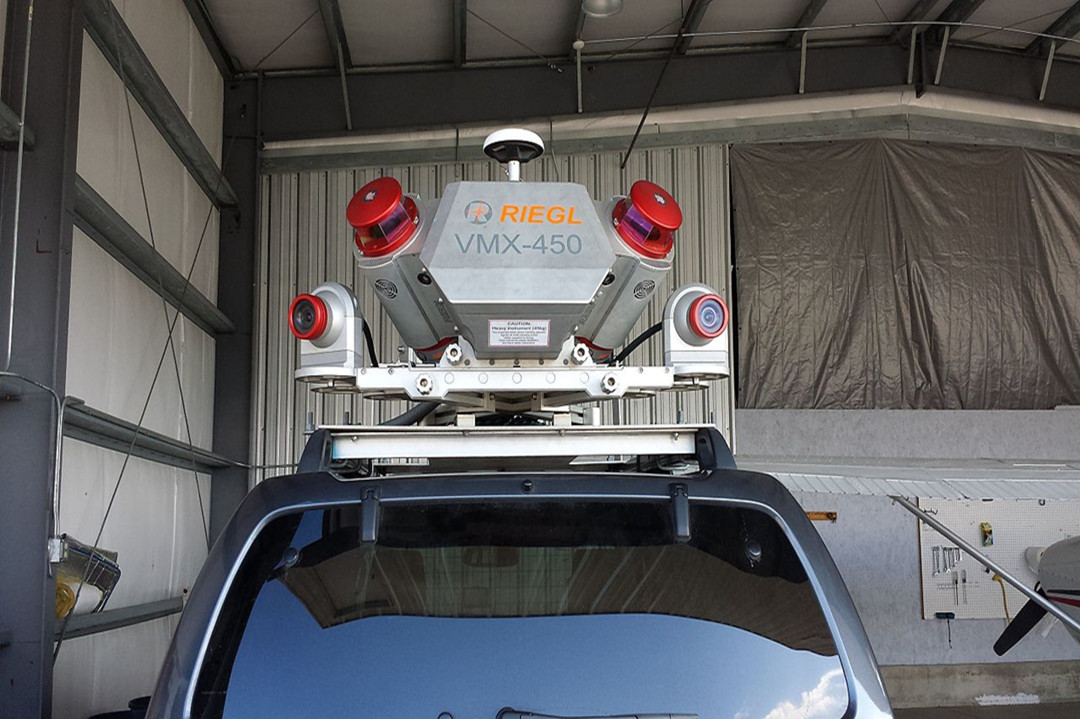
Mobile LiDAR

GNSS/IMU positioning can support mapping in open-sky conditions. In tunnels, urban canyons, and areas with limited satellite visibility, SLAM (Simultaneous Localization and Mapping) may be used to estimate movement by matching successive scans.

A key challenge is trajectory drift: small positioning errors can accumulate as the system moves. Loop closure and scan registration help reduce this drift by identifying areas that have been observed more than once.

Mobile LiDAR processing also needs to account for reflections from glass, wet pavement, and other reflective surfaces, as well as moving objects such as vehicles and pedestrians.

Best LiDAR Data Processing Software and Tools

Best LiDAR Data Processing Software and Tools

No single package covers the whole chain well. Ask three surveyors which software is used for LiDAR data processing, and you will get four answers. Most production shops run three or more tools and pass data between them, which is why format compliance matters more than feature lists.

Commercial LiDAR Data Processing Software

Software

Strengths

Where it struggles

JoLiDAR Software (JOUAV)

Integrated UAV LiDAR workflow covering device control, POS processing, point cloud generation, visualization, editing, adjustment, and quality inspection

Designed for compatible JOUAV LiDAR workflows; confirm sensor compatibility and project requirements

TerraScan / TerraMatch (Terrasolid)

Best-in-class classification and strip adjustment; deep calibration tooling; handles very large blocks

Steep learning curve; MicroStation dependency; expensive

LP360 (GeoCue)

Strong UAV and aerial workflow; good QA/QC and accuracy reporting; accessible for smaller teams

Less capable on complex feature extraction than dedicated tools

LiDAR360 (GreenValley)

Broad toolkit: terrain, forestry, power line, mining modules; good value

Interface and documentation vary by module

Global Mapper Pro

Fast terrain and point cloud analysis; excellent format breadth; GIS-friendly

Not a production classification environment

ArcGIS Pro

Native LAS dataset handling, spatial analysis, and integration with the rest of a GIS

Classification editing is weaker than dedicated point cloud tools

DJI Terra

Simple, fast reconstruction for DJI LiDAR payloads

Limited to that ecosystem; shallow classification control

These packages serve different workflows, so they should not be treated as interchangeable. Before selecting one, test it with representative project data and confirm that it can produce the required deliverables.
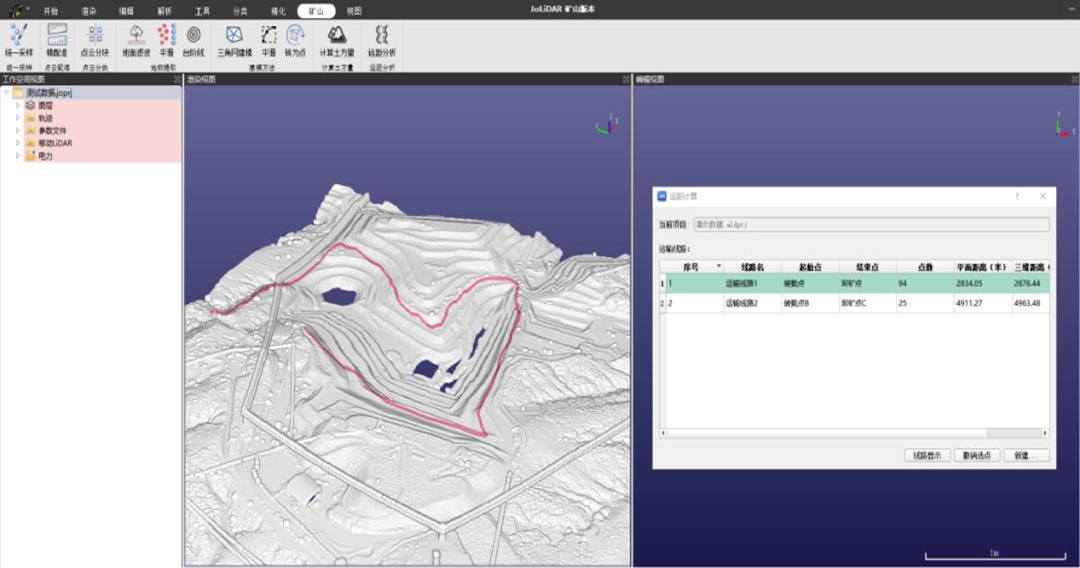
Point Cloud Classification and Optimization

JoLiDAR: JOUAV's UAV LiDAR Point Cloud Processing Software

Free and Open-Source LiDAR Processing Software

Free and open-source tools can support point cloud inspection, automated processing, GIS analysis, and custom development.

ToolMain use
CloudComparePoint cloud visualization, comparison, registration, distance measurement, and manual inspection
PDALAutomated point cloud processing through configurable pipelines
QGISGIS analysis and mapping with supported point cloud and raster data
laspyReading, writing, and manipulating LAS/LAZ data in Python
Open3D3D data processing, point cloud registration, and geometric analysis

A note on LAStools: LAStools provides command-line utilities for tasks such as format conversion, tiling, and point cloud processing. However, not every component is open-source or unrestricted for commercial use. Some tools have licensing requirements, so check the terms of each utility before using it in a commercial workflow.

How to Choose the Right LiDAR Data Processing Software

Rather than choosing software based only on its feature list, evaluate it against the actual work your team performs.

Consider these six factors:

  1. Sensor and format compatibility: Can the software read the scanner's raw data or the point cloud formats your team receives? Does it support LAS/LAZ and the required export formats?

  2. Trajectory and strip adjustment: Does it support the positioning, calibration, and alignment operations required by your sensor and project?

  3. Classification and editing: Can users inspect and correct difficult areas efficiently? Does it support the classification scheme required by the client?

  4. Automation and batch processing: Can repetitive operations be run through scripts, command-line tools, or processing pipelines?

  5. Quality control and reporting: Does it provide useful adjustment statistics, checkpoint comparisons, and accuracy reports?

  6. Licensing and total cost: Consider software licenses, optional modules, maintenance fees, hardware requirements, and staff training.

Some projects use dedicated LiDAR software for trajectory processing and point cloud adjustment, alongside GIS or drone mapping software for downstream analysis and deliverable generation.

LiDAR Data Processing Services: In-House vs. Outsourcing

LiDAR Data Processing Services: In-House vs. Outsourcing

Organizations can process LiDAR data with an internal team or hire a specialist provider. The right option depends on project frequency, technical requirements, budget, data security, and available expertise.
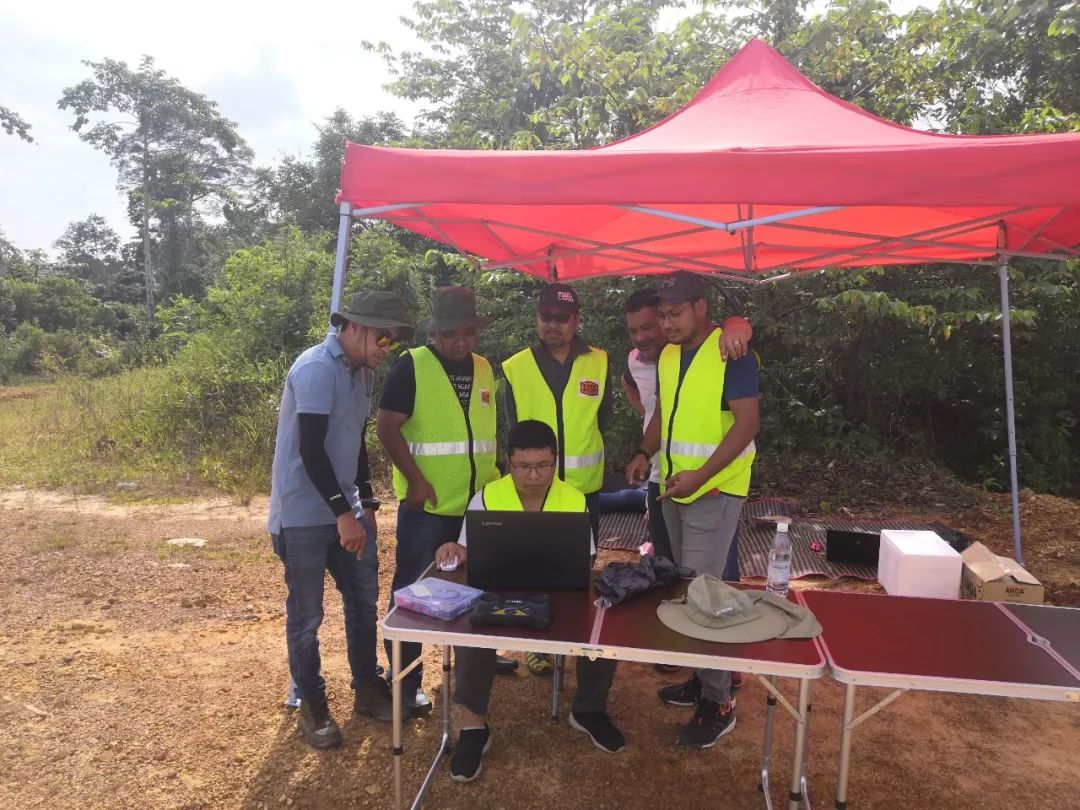
Real-time data processingu

What Do LiDAR Data Processing Services Include?

A LiDAR data processing service may cover some or all of the following:

  • Raw data review and trajectory post-processing

  • Point cloud georeferencing and strip adjustment

  • Noise removal and point cloud classification

  • Manual classification editing

  • DEM, DTM, DSM, and contour generation

  • Feature extraction, such as buildings, power lines, or vegetation

  • Accuracy assessment using independent checkpoints

  • Data export, metadata preparation, and quality-control reporting

Not every provider includes all these tasks. Some services deliver a georeferenced or classified point cloud, while others provide complete survey products with feature layers and accuracy reports.

Before hiring a provider, define the required processing stages, classification scheme, accuracy criteria, deliverable formats, and editing scope.

In-House Processing vs. Outsourcing

FactorIn-house processingOutsourced processing
Initial investmentRequires software, hardware, and staff trainingUsually based on project-specific pricing
Technical expertiseDeveloped internally over timeAccess to the provider's existing specialists
Data controlGreater direct control over data and workflowDepends on contract and provider arrangements
Workload flexibilityBest suited to recurring workloadsUseful for fluctuating or occasional projects
Quality consistencyDepends on documented procedures and staff capabilityDepends on provider standards and quality control
Project flexibilityEasier to revise workflows internallyChanges may require contract adjustments
Main riskDependence on internal staff and resourcesDependence on provider capacity and service quality

When Should You Outsource LiDAR Data Processing?

Outsourcing can be a good option when an organization only handles a few large projects each year, lacks specialized processing expertise, or needs a deliverable outside its normal scope. It can also help when a project has a fixed deadline and the internal team is already at capacity.

In-house processing is often more practical when LiDAR projects are frequent, data must remain within the organization, or the workflow requires close collaboration between field crews and data processors.

A hybrid approach is also possible. An organization can handle routine data preparation and initial processing internally while outsourcing specialized tasks such as detailed feature extraction, manual editing, or independent quality assessment.

How Much Does LiDAR Data Processing Cost Per Acre?

How Much Does LiDAR Data Processing Cost Per Acre?

Anyone quoting a single national per-acre rate is either oversimplifying or selling a narrow product. Processing cost scales with data volume and with the decisions you make about quality, and the spread between a basic classified cloud and an engineering-grade deliverable is easily tenfold.

That said, indicative ranges exist. What follows reflects commonly quoted U.S. market pricing — treat it as a planning input, not a quote.

Scope

Typical range (per acre)

Basic classification on large aerial blocks (thousands of acres)

$0.50 – $3

Standard survey-grade: classification, DEM/DSM, accuracy report

$5 – $15

Engineering grade: breaklines, hydro enforcement, contours, QA/QC

$15 – $40

Small UAV sites (under ~100 acres), full deliverable

$50 – $250

Minimum project fees of roughly $500-2,500 are common, which is why per-acre pricing collapses on small jobs.

What Factors Affect LiDAR Data Processing Costs?

  • Area and point volume. Cost tracks point count more closely than acreage. A 200 points/m² site costs several times what a 20 points/m² costs in the same area.
  • Terrain and vegetation. Open terrain is fast. Dense canopy, steep gullies, and urban clutter each add manual editing hours, and they compound.
  • Classification depth. Ground-only is a fraction of the work of the full ASPRS classification with vegetation strata, buildings, wires, and road surfaces.
  • Deliverable set. Each product—contours, breaklines, cross sections, feature vectors, orthophoto—carries its own QC burden.
  • Accuracy requirement. Tightening vertical RMSE from 15 cm to 5 cm means more control, more adjustment iterations, and more checking.
  • Data condition. A clean, well-flown block with good overlap processes predictably. Missing base data, poor time sync, or thin overlap turns a fixed-price job into a change order.
  • Turnaround. Rush delivery is a staffing decision, and it is priced as one.

LiDAR Data Processing Cost vs. LiDAR Survey Cost

LiDAR survey costs and LiDAR processing costs are related but different.

Data acquisition generally includes mobilization, field crews, the aircraft or UAV, the LiDAR sensor, flight operations, GNSS reference setup, and ground control surveys where required.

Data processing covers the work performed after collection, such as trajectory processing, georeferencing, strip adjustment, filtering, classification, modeling, and quality control.

Some providers quote these services separately, while others offer a combined price for acquisition and processing. When comparing quotes, make sure the scope is clear. A low per-acre price may exclude ground control surveys, detailed manual editing, breaklines, hydro-enforcement, or revisions.

How to Estimate LiDAR Data Processing Costs?

Build the estimate from components rather than looking for a rate:

Total ≈ base processing + classification depth + modeling and deliverables + QA/QC + project management

Then apply the modifiers that actually move the number: vegetation density, terrain relief, accuracy class, and schedule. For a 500-acre mixed-terrain site with standard classification and a DEM/DSM plus contours, a range of $7,500-15,000 is a plausible planning figure—and a site with heavy canopy on the same acreage can double it.

Two sanity checks before signing: ask for the assumed point density in the quote (it explains most of the price variance between bidders), and ask what happens if the data arrives with a trajectory problem. The answer tells you whether the price includes risk or excludes it.

Common Challenges in LiDAR Data Processing and How to Solve Them

Common Challenges in LiDAR Data Processing and How to Solve Them

LiDAR processing problems may appear in a final DEM or point cloud even when the underlying cause occurred much earlier in the workflow. Identifying the source of an error is usually more effective than trying to correct the final output alone.

Challenge

Likely cause

Fix

Misaligned flight strips

Attitude drift, boresight error, weak GNSS

Strip adjustment, then recheck trajectory solution

Excessive noise

Sensor limits, rain, reflective surfaces

Tune filters by surface type; mask water before filtering

Poor ground classification under canopy

Low vegetation within terrain height band

Smaller windows, lower thresholds, manual editing

Inconsistent point density

Flight planning, scan geometry, overlap

Adjust line spacing and FOV; report density per tile

DEM shows vegetation lumps

Ground filter too permissive

Re-run with tighter thresholds; verify against check points

Bridges damming the DEM

Deck points classified as ground

Reclassify to Class 17; enforce hydro

Elevation offset across the whole site

Datum or geoid mismatch

Confirm CRS and geoid model; recompute in the correct frame

Slower than expected processing

Point volume, single-threaded tools, disk I/O

Tile the block, batch process, move to local SSD

A useful diagnostic principle is to trace the problem back to the stage where it originated. For example, a consistent vertical offset may indicate a datum issue, while differences between overlapping flight strips may point to trajectory or calibration problems.

Applications of Processed LiDAR Data

Applications of Processed LiDAR Data

The value of LiDAR processing depends on the information that needs to be extracted from the point cloud. Different applications require different classification schemes, surface models, and levels of detail.

Topographic Surveying and Terrain Mapping

Processed LiDAR provides detailed elevation information for topographic mapping, land development, drainage analysis, and civil engineering.

Ground classification is particularly important in vegetated areas because LiDAR can capture multiple returns from vegetation and, under suitable conditions, detect the terrain beneath the canopy. This allows surveyors to derive bare-earth terrain models from areas where photogrammetry may primarily capture the upper vegetation surface.

Forestry and Vegetation Analysis

Classified LiDAR data can support tree detection, canopy height measurement, vegetation structure analysis, and biomass estimation.

Multiple returns provide information at different heights within the canopy. First returns may represent the upper canopy, while later returns can provide observations from lower vegetation and the ground. The availability and quality of these returns affect which forestry metrics can be derived.
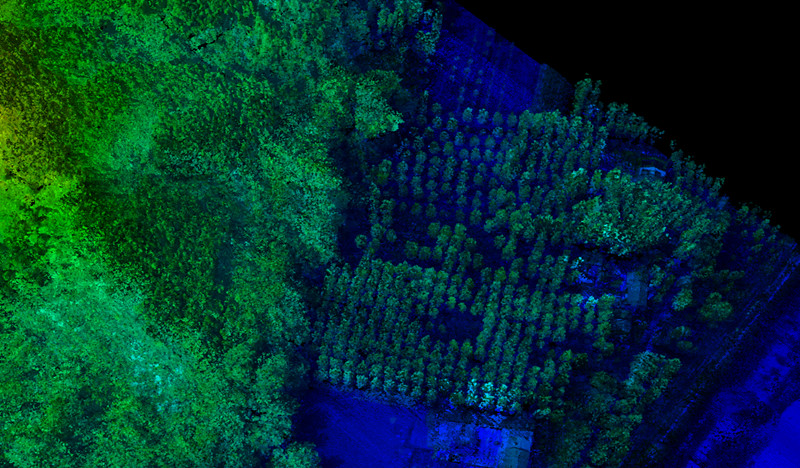
Tree Density Analysis

Power Line and Utility Inspection

Power line applications use LiDAR data to identify conductors, towers, poles, and surrounding vegetation.

Processing may include conductor extraction, wire modeling, vegetation clearance measurement, and analysis of asset conditions. The required outputs are often specific to utility management, such as clearance measurements linked to asset IDs, rather than general-purpose elevation models.
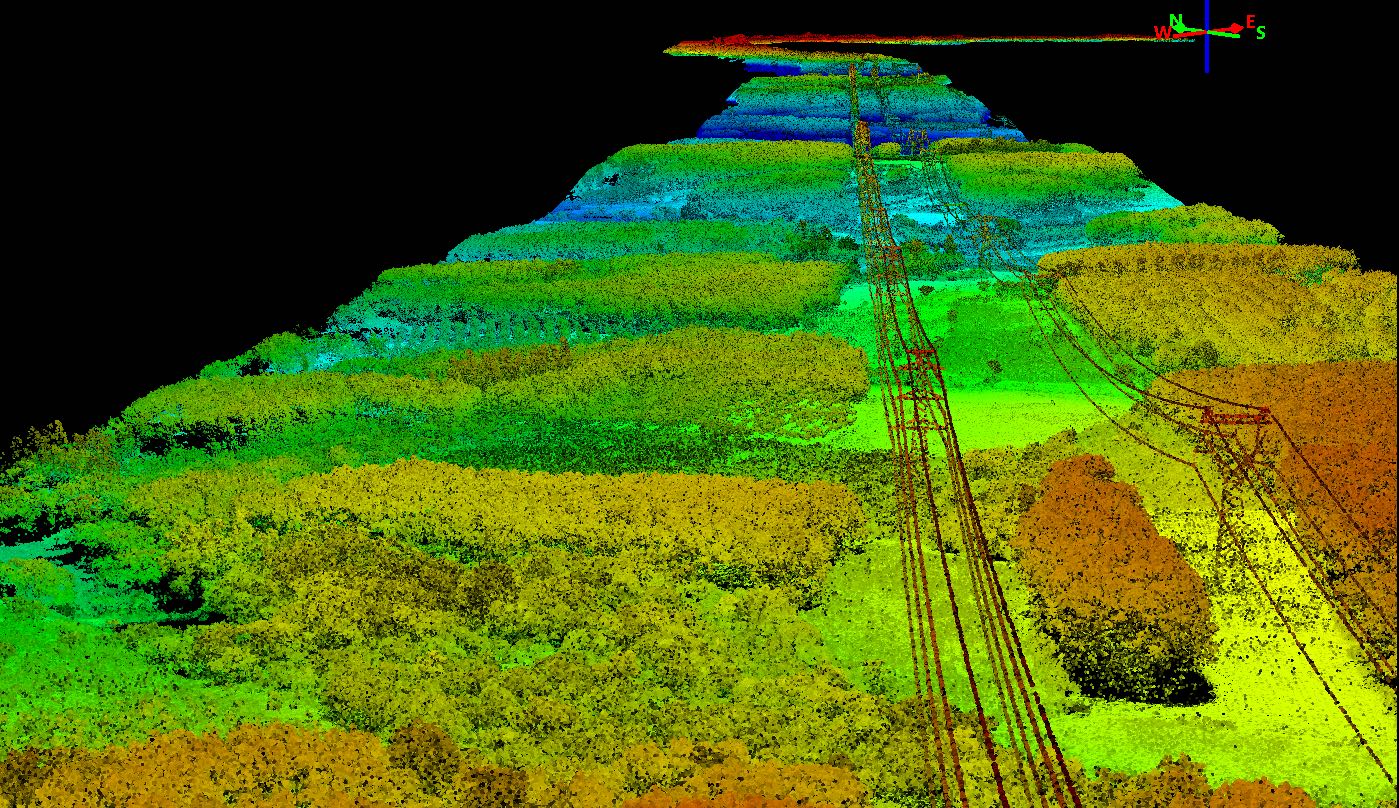
Point cloud of powerline inspection

Mining and Construction

In mining and construction, processed LiDAR data supports stockpile volume calculations, terrain measurement, bench modeling, haul road analysis, and progress monitoring.

For multi-epoch comparisons, consistent classification and processing settings are important. Changes in parameters between surveys can affect volume calculations and make it harder to distinguish actual site changes from processing differences.
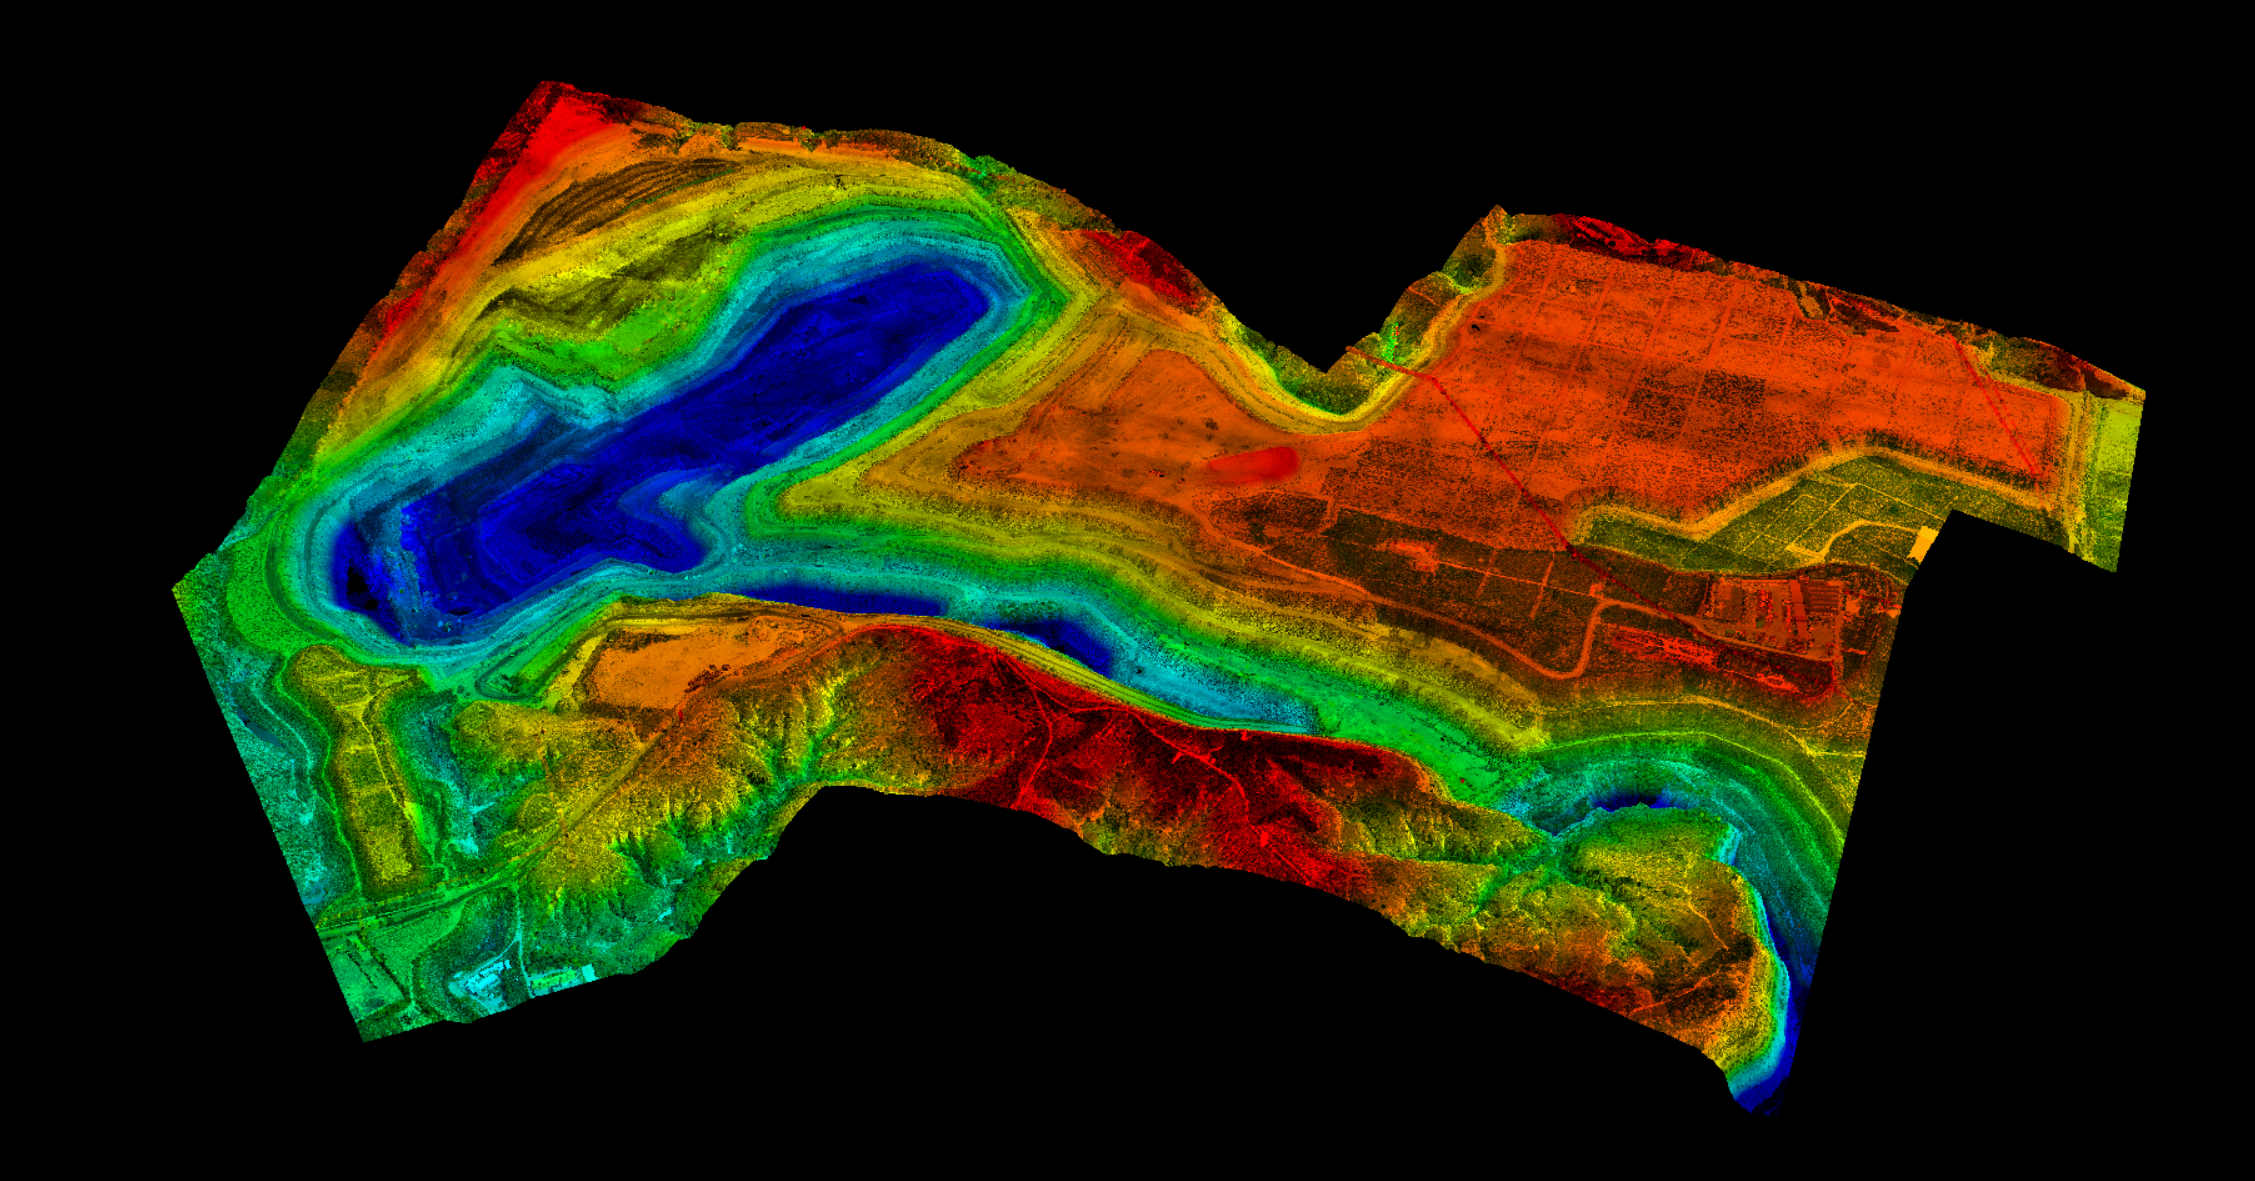
LiDAR point cloud of Baorixile open-pit mine

FAQ

FAQ

How long does LiDAR data processing take?

For standard classification and DEM production, plan on roughly three to ten times the acquisition time—a two-hour flight becomes one to three days of processing including QA. Complex feature extraction, dense canopy, or engineering-grade contours push that further, and large aerial blocks run into weeks regardless of automation.

What software is used for LiDAR data processing?

TerraScan and TerraMatch, LP360, LiDAR360, Global Mapper Pro, and ArcGIS Pro are common commercial choices; CloudCompare, PDAL, LAStools, and QGIS cover most open-source needs. Payload vendors also supply their own tools, which usually handle trajectory processing and basic classification well.

What is the difference between raw and processed LiDAR data?

Raw data is sensor measurements plus an uncorrected trajectory — no strip alignment, no classification, and often no final coordinate frame. Processed data has a smoothed trajectory applied, strips aligned, noise removed, points classified to a standard, and accuracy verified against independent check points.

Can LiDAR data be processed in ArcGIS?

Yes, for the later stages. ArcGIS Pro handles LAS datasets, visualization, ground classification, raster generation, and spatial analysis well. It is not built for trajectory post-processing or rigorous strip adjustment, so those steps belong in dedicated software.

Can Python be used for LiDAR data processing?

Yes, and it is the standard route for automation. PDAL handles filtering and classification pipelines, laspy reads and writes LAS/LAZ, Open3D covers registration and geometry, and NumPy handles the array work. Python is weaker for interactive manual editing, so most teams script the batch work and edit in a GUI tool.

What is the difference between LiDAR data processing and point cloud classification?

Classification is one step inside processing. Processing covers the whole chain — trajectory, georeferencing, strip adjustment, filtering, classification, modeling, and QA. A classified cloud is a mid-chain product, not a finished deliverable.

How accurate is processed LiDAR data?

For UAV LiDAR with PPK and ground control, 3–5 cm relative accuracy and 5 cm absolute vertical accuracy are achievable and commonly specified. Manned airborne surveys typically specify 10 cm RMSEz at typical densities. Actual accuracy depends far more on trajectory quality and control than on point density.

Can LiDAR be processed without ground control points?

Often, yes. With a good PPK trajectory and well-distributed strip overlaps, relative accuracy is usually sufficient, and absolute accuracy can be acceptable for many mapping purposes. For survey-grade vertical accuracy, contract deliverables, or anything used as a legal record, independent checkpoints are still the only way to prove the data meets specifications.

Share :
Read More
thumbnail
A drone survey costs $500 to $4,000 for a small site, $4,000 to $15,000 for a mid-sized project, and $15,000 to $60,000 for a large one. Above roughly 1,000 acres, providers usually quote per acre ins
thumbnail
Most drone failures don’t start in the air. They start on the ground, in the five minutes of inspection that someone decided to skip. A loose propeller. A battery that swelled slightly since las
thumbnail
Your drone promises up to 46 minutes of flight time, but you’re back on the ground much sooner than expected. What happened? In practice, advertised flight times are maximum figures measured under spe