Let me tell you something that happens way too often.
A company spends $15,000 on a drone, excited about the flight time and range. They get it in the air and mount their LiDAR sensor—and the drone ba
What Is a Topographic Map?
A topographic map is a detailed, accurate representation of both natural and man-made features on the ground, including roads, railways, power lines, rivers, lakes, and elevations. Essentially, it is a two-dimensional illustration of the Earth’s three-dimensional landscape, allowing you to visualize terrain features like mountains, valleys, and slopes.
Topographic maps convey a wide range of information:
- Relief: mountains, valleys, slopes, and depressions shown through contour lines.
- Hydrography: rivers, lakes, streams, swamps, rapids, and waterfalls.
- Vegetation: forests and wooded areas.
- Transportation: roads, trails, railways, bridges, airports, and seaplane anchorages.
- Culture: buildings, urban developments, power lines, pipelines, and towers.
- Boundaries: international, provincial, administrative, and recreational boundaries.
- Toponymy: place names, water features, landforms, and boundary names.
How to Read a Topographic Map?
Before you try to “read the story” a topographic map tells, learn its language. That language has four fundamentals: contour lines, map scale, symbols & colors, and the grid/coordinate system. Read the map margin first—it lists the contour interval, scale, datum/projection, and edition year—because everything you do afterwards depends on those facts.
Contour Lines—The Shape of the Land
Contour lines join points of equal elevation and are how a flat map represents three-dimensional terrain. The vertical spacing between adjacent contours (the contour interval) is printed in the margin and controls vertical resolution: a 5 m interval shows much more detail than a 50 m interval.
Every few contours you’ll see a heavier, labeled index contour for quick reading; the lighter lines between them are intermediate contours.
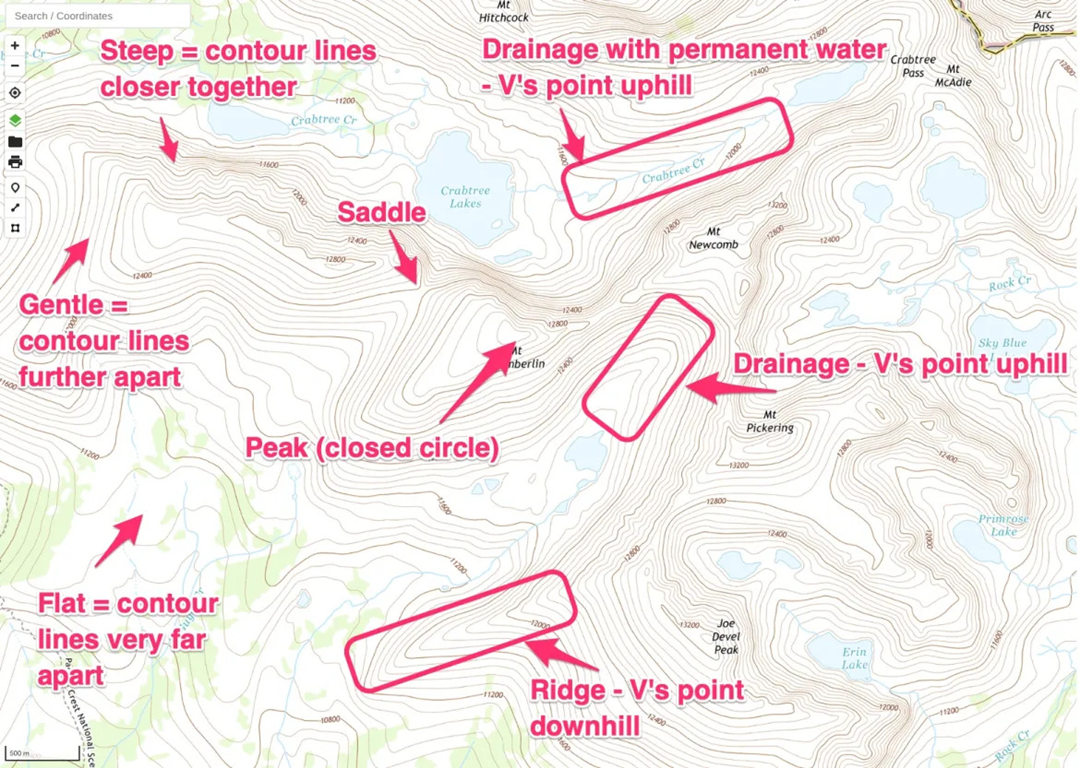
Patterns in contours are the fastest way to identify landforms:
Peak: Concentric closed contours mark hills or mountains. The summit may show an elevation, name, or “X.”
Valley: V-shaped contours that point uphill; the open end of the “V” points downstream.
Ridge: V-shaped contours pointing downhill.
Saddle: Hourglass-shaped contours marking low ground between two peaks.
Comparison of topographic landforms and their relative steepness on US Topo maps in GaiaGPS.
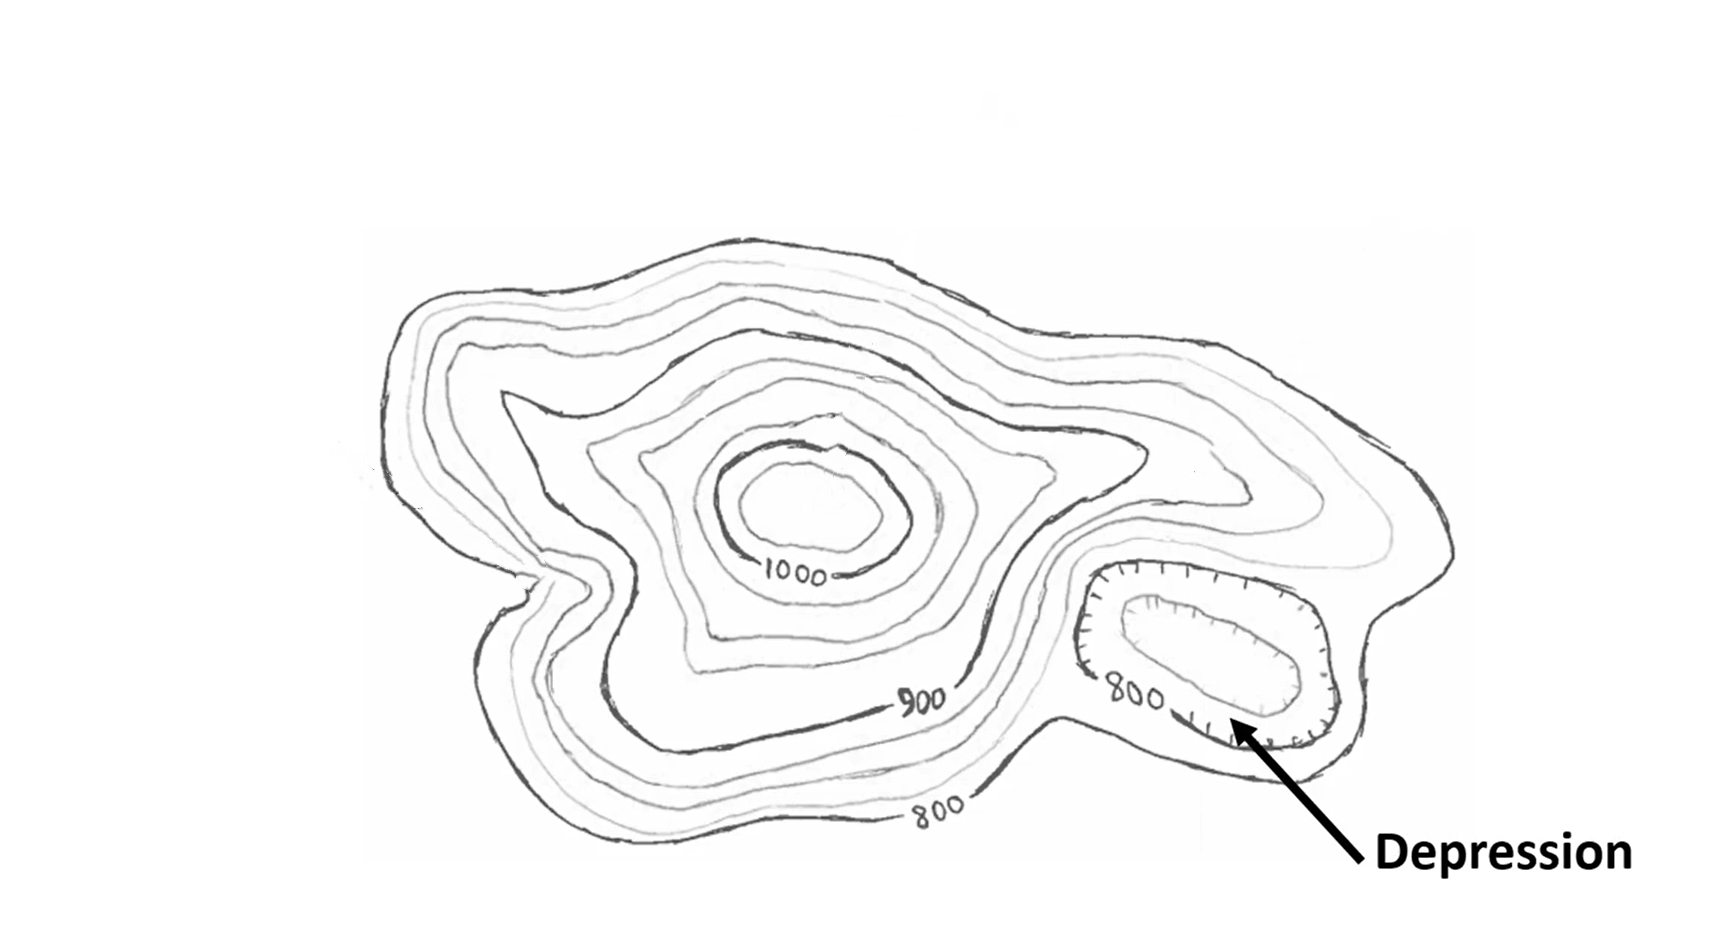
Depression: Closed contours with inward-facing tick marks (hachures).
Landscape features. Source: YouTube video "Topographic Maps" by Devin Lea.
Understanding Slope: The distance between contours indicates steepness. Close together = steep slope. Far apart = gentle slope.
You can calculate the slope percentage using the contour interval and the map scale:
Quantitatively you can compute slope% with: Slope (%) = (vertical change ÷ horizontal distance) × 100.
Example: contour interval = 20 m; map scale = 1:50,000 (1 cm on map = 50,000 cm on ground = 500 m).
If the map distance between two contours = 0.5 cm, the horizontal ground distance = 0.5 × 500 m = 250 m. Slope% = (20 ÷ 250) × 100 = 8.0% (≈ 4.6°).
For engineering or safety-critical decisions, treat the topo map as a first estimate and verify with a clinometer, survey measurements, or a DEM/LiDAR model.
Map Scale—What the Map Can Show
Scale converts map units to ground units and tells you the map’s inherent detail and coverage.
The representative fraction (RF) is written as 1:50,000: one unit on the map equals 50,000 units on the ground.
Converting RF to useful numbers: 1:50,000 → 1 cm on the map = 50,000 cm on the ground = 500 m.
Use the graphic/bar scale for field measuring because it remains correct even if the map image is resized.
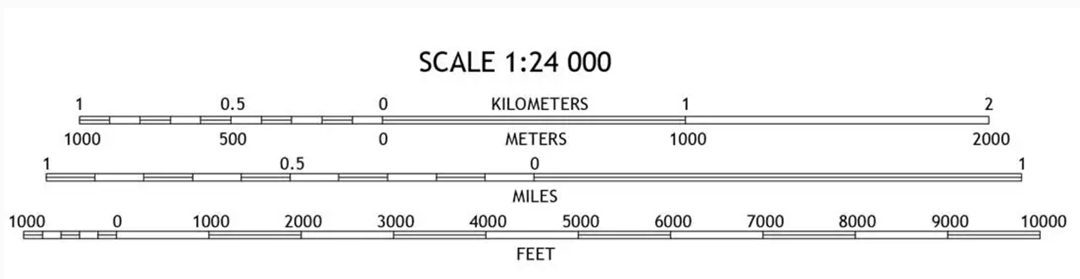
A set of map scales from a USGS 7.5-minute Topo map. Source: mapserve.co.uk.
Think in scale categories:
- Large-scale maps (1:5,000–1:25,000) show high detail for site work;
- Medium scales (around 1:25,000–1:100,000) are good for hiking and regional planning;
- Small-scale maps (1:100,000 and above) provide broad overviews but often omit small features.
When accuracy matters (e.g., survey, construction), use large-scale or survey-grade data rather than a generalized topo map.
Symbols & Colors—Categorical Information at a Glance
A map’s legend decodes symbols and colors—always read it first because conventions vary between agencies. Typical conventions you’ll see:
- Brown for contours, blue for water features, green for vegetation, black for human-built features, and red for major roads or boundaries.
- Symbols come in three types: point (tower, benchmark), linear (road, pipeline), and area (forest, urban extent).
- Typography and label orientation also carry information: larger type usually means more important features.
Never assume a symbol’s meaning without checking the legend, and remember many symbols are schematic at smaller scales—a “trail” symbol on a 1:100,000 map may not represent a usable route on the ground.
US Topo Map Symbol File Sample. Source: USGS
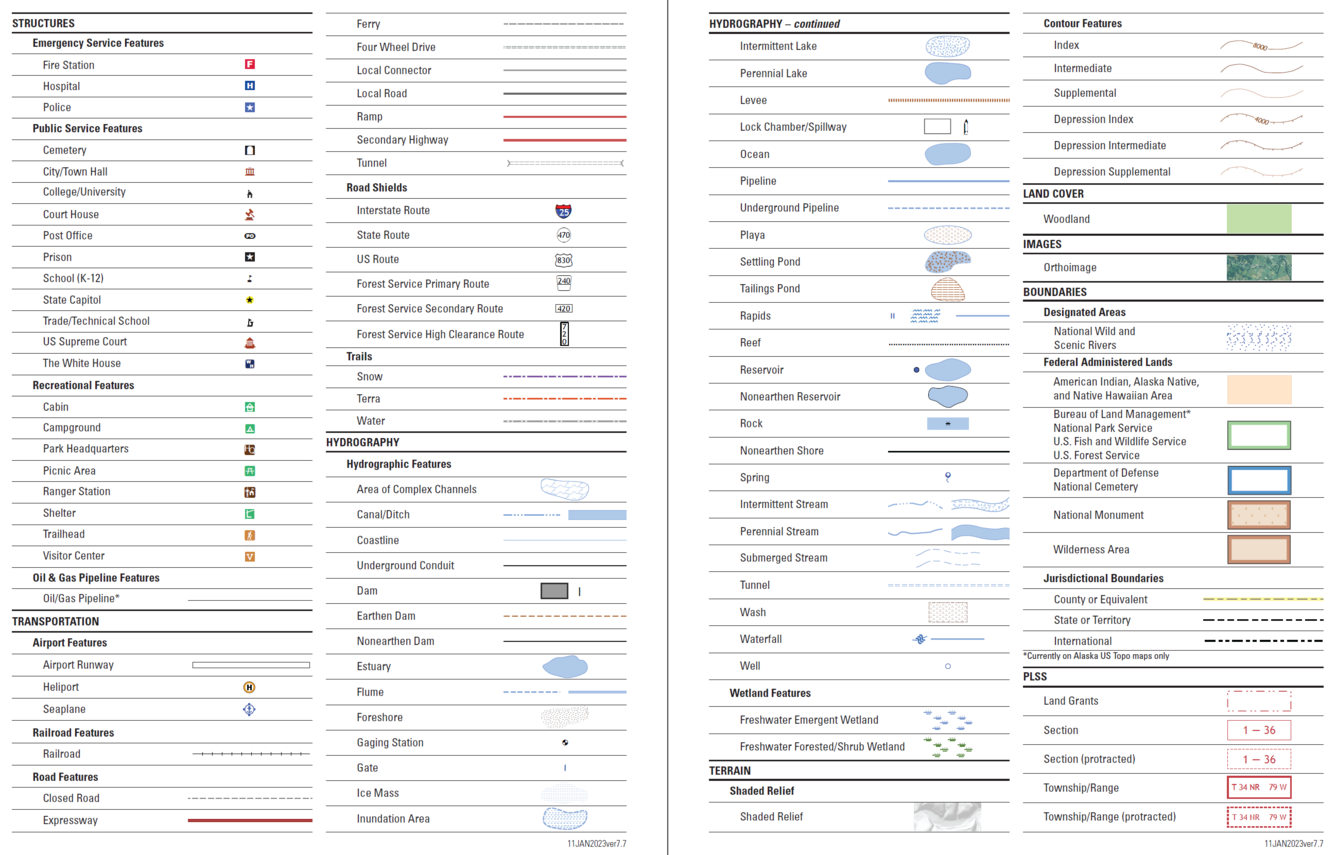
Grid System & Coordinates—Precise Positioning and Integration
Grids let you reference positions exactly and match map features to GPS and survey data. Topo maps commonly show both latitude/longitude (good for global references) and a projected grid such as UTM (useful for metric distance and engineering because it preserves local shapes and distances). In projected grids, you read the easting (X) first, then the northing (Y).
Crucially, check the datum and projection in the map margin (for example, WGS84, NAD83, GDA). Different datums produce systematic shifts in coordinates; if your GPS or drone uses a different datum than the map, you can see offsets of tens to hundreds of meters.
For precise work—drone flight planning, LiDAR/photogrammetry processing, and survey control—always align datum and projection across map, GPS, and processing software.
Military users may prefer MGRS grid references for compact field reporting; civil engineering teams typically use full easting/northing coordinates.
You can interpolate within a grid square to estimate coordinates to the nearest 10–100 m, depending on scale: read the grid line values at the square edges, measure the fractional distance across the square, and add that fraction to the lower grid value.
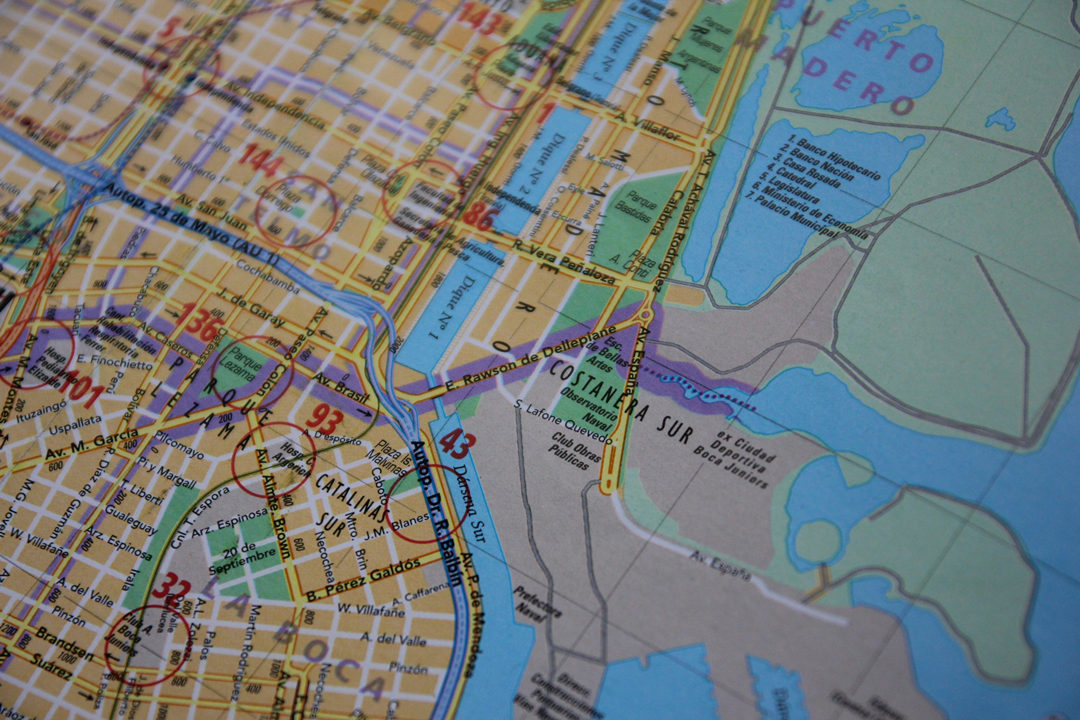
UTM and latitude/longitude coordinates on a topographic map. Source: Public Domain.
Practical Reading Workflow
Begin at the margins. Confirm the contour interval, scale, datum/projection, map edition, and legend.
Make a quick visual scan of the map face to locate high and low ground, major drainage, roads, built-up areas, and obvious hazards like cliffs or swamps.
Identify contour patterns (concentric loops, V-patterns) to find peaks, saddles, ridges, and valleys. Where slope matters, measure separation between contours, convert map distance using the scale, and compute slope% if needed.
Use the grid to fix precise positions and check that your GPS or drone flight plan uses the same datum.
For route planning, prefer saddles and gentler contour spacing; avoid cliff symbols and very tight contour bands.
For engineering tasks, use the topo map to identify likely cut/fill areas, drainage lines, and benches, but rely on survey or LiDAR data for final design.
For drone operations, use the topo map to choose safe launch/recovery sites, place ground control points on stable visible features, and plan flight corridors that avoid steep approaches over populated areas—and again, ensure coordinate systems match across all datasets.
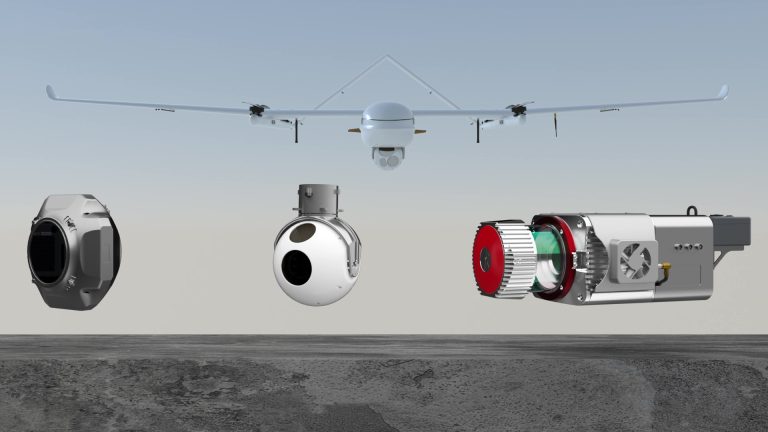
The JOUAV CW-25E takes off over the expansive mining site.
Common Mistakes and Tips for Beginners
Do not assume the map is current—check the edition year and cross-check with recent aerial imagery or drone orthophotos.
Never overlook the contour interval; a small interval map can show features that a coarse-interval map hides.
Don’t mix datums; coordinate mismatches are a frequent and costly error.
Finally, remember that topo maps are generalized—small terraces, recent earthworks, or man-made changes may not be shown.
Practical Applications of Topographic Maps
Topographic maps are far more than hiking aids; they’re a foundational dataset used across many disciplines. Their value comes from the way they combine elevation, landform patterns, hydrography, and human infrastructure into a single, readable picture.
Engineering, Construction, and Earthworks
Engineers use topo maps at the earliest stages to screen sites, assess access routes, and estimate earthwork quantities.
Contour maps reveal natural drainage paths, gullies, benches, and slope gradients that influence cut/fill balance, road alignments, and foundation choices.
For preliminary design, a medium-to-large scale (1:5,000–1:25,000) topo is common; for detailed design, you must move to survey-grade data or high-resolution DEMs.
In practice, a workflow looks like this: use the topo map to identify candidate alignments, conduct a targeted survey or drone mapping to capture fine detail, then import the DEM into CAD/earthworks software for volumetric and stability analysis.

Mining and Quarrying
Topographic maps guide early resource access planning, pit orientation, and haul-road routing.
Contour patterns and bench indicators help assess haul distances, slope stability zones, and drainage diversion needs.
However, mining requires high vertical and horizontal precision; topo sheets are a planning tool only.
Mines rapidly move to regular drone LiDAR or photogrammetric surveys to measure stockpile volumes, monitor wall stability, and track changes over time.
When integrating topo maps with drone outputs, always match projections and datum to avoid offset errors in designs and reporting.
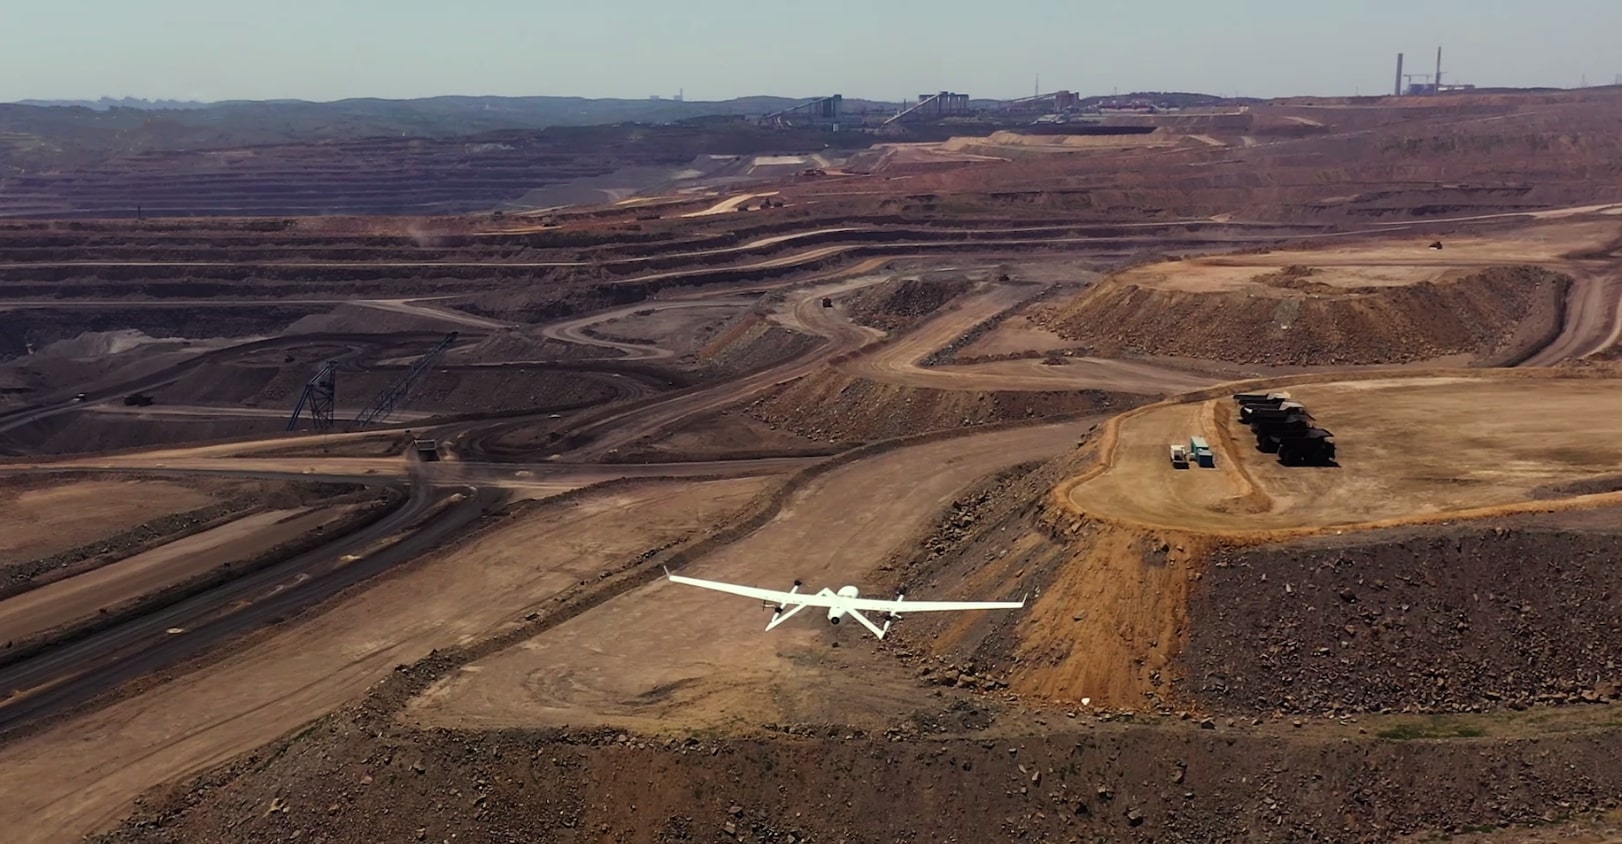
At the Baorixile open-pit mine, the CW-25E captured radar data with remarkable precision—achieving a 6.5× increase in data collection efficiency and a 180% improvement in overall operations. Click to explore this case study.
Environmental Assessment and Watershed Management
Hydrography and relief on topo maps make them ideal for watershed delineation, floodplain screening, and habitat mapping.
Contours reveal catchment divides and likely overland flow paths; wetland and marsh symbols indicate potential ecological sensitivities.
For environmental planning, use topo maps to prioritize field survey locations and choose sampling transects, then validate with hydrologic models and remote sensing (multispectral imagery, LiDAR) for inundation mapping and sediment routing studies.
Transport, Pipeline, and Powerline Corridor Planning
Route corridors for roads, pipelines, and transmission lines are selected to balance cost, environmental impact, and constructability.
Topo maps help identify natural corridors (valleys, flat benches) and hazards (cliffs, wetlands) and estimate cut/fill lengths.
For transmission lines, contour-derived slope and aspect inform tower foundation design and helicopter lift planning.
Corridor planning typically starts with medium-scale topography and then requires corridor-scale high-resolution surveys (often drone-mapped) to design tower positions, access tracks, and crossing strategies.

Disaster Response, Search & Rescue, and Emergency Planning
Topo maps provide responders with a rapid understanding of escape routes, potential ambush points for floodwaters, and safe staging areas.
Emergency planners use contour data to delineate areas at risk from landslides, debris flows, and flash flooding.
Because conditions change rapidly after an event, responders commonly combine topo maps with near-real-time aerial imagery or drone reconnaissance to confirm road passability, locate stranded groups, and plan safe evacuation routes.
Urban and Regional Planning
Planners use topo maps to assess developable land, drainage constraints, and suitability for infrastructure. Slope thresholds derived from contours inform zoning and lot layout.
For master planning, topographic maps are combined with cadastral, soil, and hydrology datasets to derive buildable envelopes and to anticipate earthworks.
At the design stage, detailed topographic surveys or LiDAR are required to produce accurate grading and stormwater plans.
Agriculture and Land Management
Contour information informs precision agriculture—field layout, erosion control (contour banks), irrigation design, and road siting.
Slope and aspect affect microclimates, crop choice, and frost risk; topo maps help agronomists and land managers place terraces, drains, and access without expensive initial surveying.
For implementation, combine topographic planning with drone imagery and soil mapping for variable-rate interventions.
Survey, GIS, and Cadastral Integration
Topographic maps remain a baseline layer in GIS. They provide context for cadastral boundaries and are often used to validate and locate survey control points.
When integrating with GPS, drones, or other spatial data, ensure consistent datum and projection, and use topo contours to check DEM integrity and to find ground control points in visually distinct, stable locations.
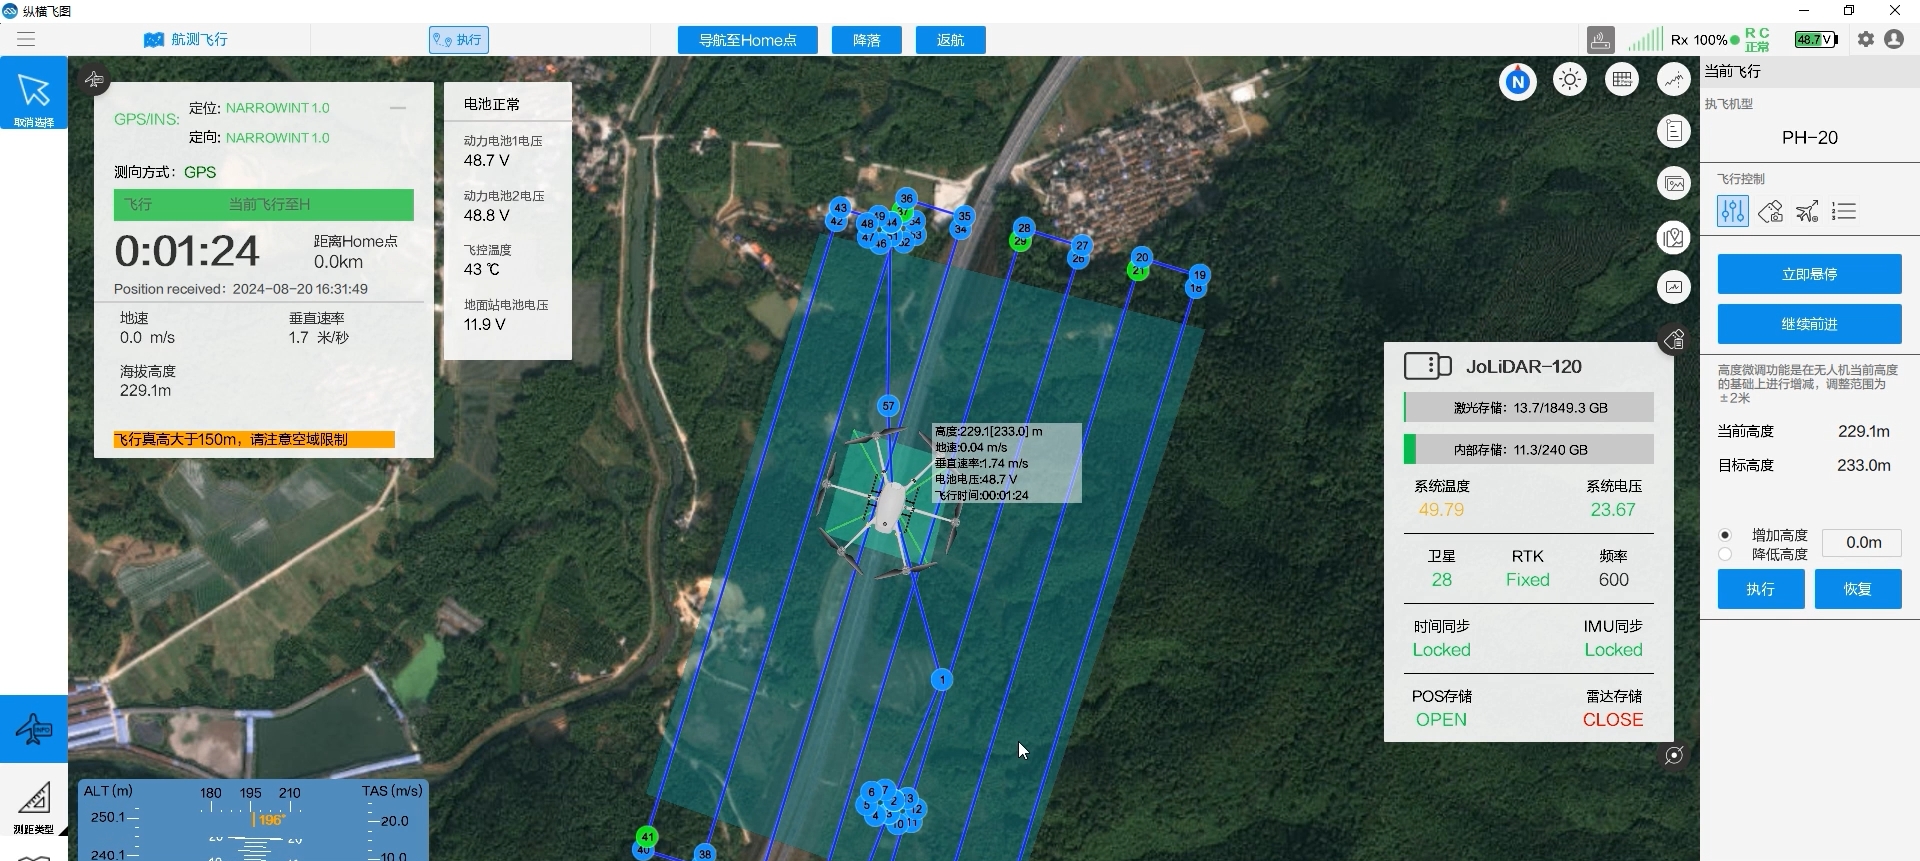
Drone Operations, LiDAR and Photogrammetry Workflows
Topo maps are essential for pre-flight planning and for integrating drone outputs into operational workflows.
Use topo maps to identify safe launch/recovery sites (flat benches, clear of obstructions), plan flight corridors that avoid steep approaches over people or structures, and pick ground control point (GCP) locations on stable, visible features.
After a flight, align drone-derived DEMs to the topo map’s grid/datum to check for registration errors and to combine legacy data with new high-resolution models.
In industries such as mining, powerline inspection, and construction, drones transform a topo map’s role from a static planning reference to a live comparison tool for monitoring change and validating design assumptions.
Outdoor Recreation and Route Planning
For hikers, backpackers, and search teams, topographic maps provide the basic situational awareness you need to plan safe routes and estimate effort.
Contour patterns identify ridgelines, saddles, and valleys for route choice; spacing of contours helps predict steep sections and potential exposure; hydrography locates water sources and marsh hazards.
Use medium-scale maps (1:25,000–1:50,000) for route planning and a larger-scale map or recent aerial photo for tricky terrain.
Always check the map date and, where possible, cross-reference trails and hazards with recent satellite imagery or local trip reports.

Advanced Tips for Accurate Map Reading
Choose the Right Map for Your Purpose
Not all topographic maps are created equal. The correct map scale depends on your activity and the level of detail you need.
For instance, a 1:50,000 map provides a broad overview suitable for route planning or regional drone surveys, while a 1:25,000 map offers finer detail for field navigation or localized terrain analysis.
In professional surveying and drone mapping, digital topographic data—often integrated with GIS or LiDAR—provides even more precise elevation and contour information, allowing accurate ground modeling and 3D visualization.
Keep Your Map Oriented and Paired with a Compass
A common mistake is reading the map “flat” without orientation. To read terrain accurately, align your map with true north using a compass or GPS.
In the U.S., magnetic declination—the difference between magnetic north and true north—varies by region, so make sure to adjust accordingly.
When you keep your map aligned with the actual landscape, hills, valleys, and rivers fall naturally into place, helping you recognize terrain faster and avoid costly misjudgments in both hiking and aerial mapping operations.
Integrate Compass and Map for Exact Bearings
A compass remains one of the most reliable navigation tools, even in the age of GPS. To take a bearing, align the compass edge with your route on the map, rotate the bezel until north on the dial matches north on the map, then turn your body until the needle aligns with the north marker.
The direction of the travel arrow now points toward your destination. This method is invaluable not just for hikers but also for surveyors verifying coordinates in the field where GNSS signals may be weak or distorted.
Interpret Terrain Features with Context
Reading terrain accurately requires recognizing how features on a map translate into real landscapes. Closely spaced contour lines indicate steep slopes, while widely spaced lines suggest flat terrain.
Valleys, ridges, and spurs form distinctive contour patterns that, once understood, allow you to visualize the land even before you see it. When analyzing drone orthophotos or LiDAR-based digital elevation models (DEMs), these same topographic principles help identify elevation changes, drainage patterns, and potential hazards like landslides or erosion zones.
Cross-Verify with Technology—but Don’t Over-Rely on It
Modern navigation tools like GPS devices, mobile apps, and drone mapping software offer impressive accuracy, but technology can fail—especially in remote areas or complex terrains. Always cross-check digital data with physical maps and ground observations.
For example, survey teams often use drone-collected elevation data alongside traditional topographic maps to validate contours and ensure consistency across datasets. The best navigators combine the strengths of both analog and digital methods.
Build Situational Awareness through Practice
True map-reading expertise comes from experience. Regularly compare the map with your surroundings, noting how the terrain, vegetation, and built structures correspond to what you see on paper or screen.
This practice sharpens your ability to interpret subtle topographic cues. For drone operators and surveyors, spending time on the ground before launching a mapping mission helps confirm environmental factors that might affect flight planning and data accuracy.
Read More

Have you ever watched a drone hover effortlessly over a construction site, inspect a wind turbine blade, or deliver medical supplies to a remote village?
That drone was almost certainly a multirotor.

Every drone needs a brain.
Without it, you’re holding an expensive paperweight with spinning blades.
That brain is called a flight controller—but most people have no idea what it actually does.

JOUAV Product News and Use Cases
Fixed-Wing VTOL Drones Insights and Industry Trends
Invitations to online demo events