At 2:27 PM on a storm-lashed afternoon in July 2025, a small fishing boat capsized off the coast of Gulei, Zhangzhou.
Two men were thrown into violent waters. Winds howled at gale force. Waves surged
About Beijing Anzhou Technology Co., Ltd
Beijing Anzhou Technology Co., Ltd is a high-tech enterprise focused on remote sensing technology. With extensive patents and software publications, and ISO9001 certification, the company has provided remote sensing equipment and support to numerous research units and universities across China.
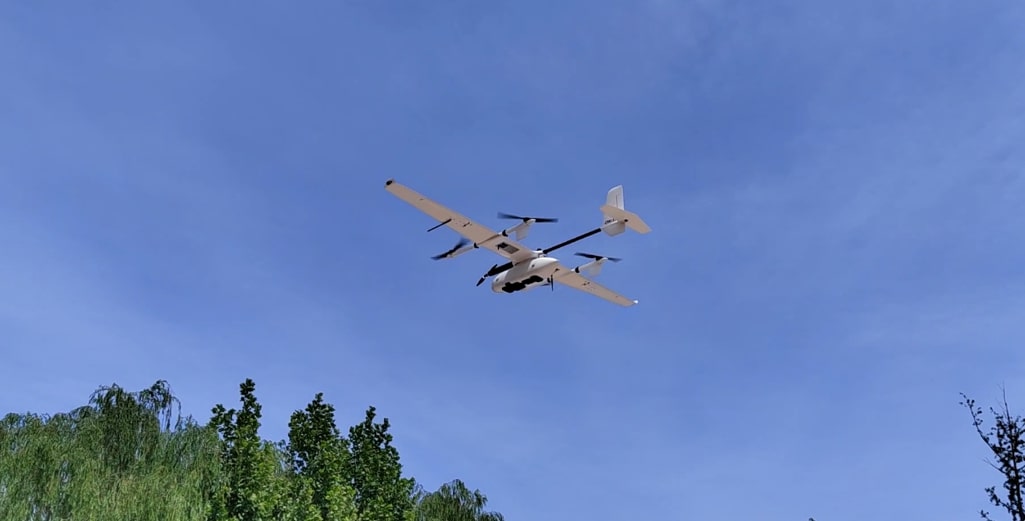
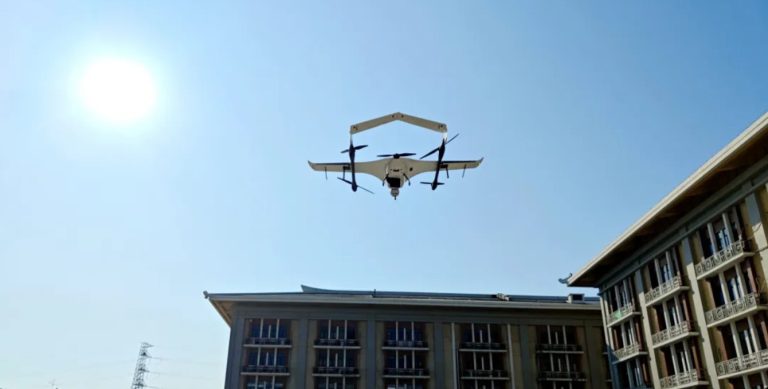
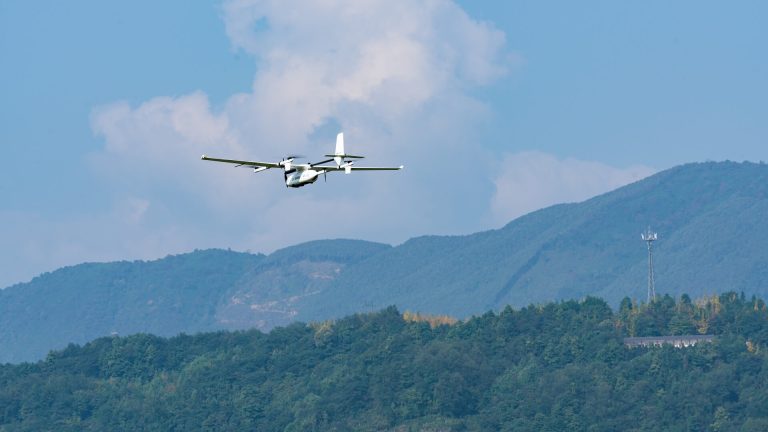
Fig.1 CW-15II VTOL drone with X20P hyperspectral camera
The Challenge of Winter Wheat Monitoring
The monitoring of winter wheat across vast agricultural fields presents a formidable challenge due to the labor-intensive and time-consuming nature of manual monitoring methods. Moreover, manual monitoring is susceptible to errors, making it crucial to develop automated monitoring systems and algorithms capable of real-time assessment of wheat growth across expansive farmland.
Seamless Integration of Drones and Hyperspectral Cameras
The CW-15 is a composite wing UAV with high operational efficiency and vertical takeoff and landing safety, as well as a 3kg load capacity, 180 minutes of endurance, and 50km of range. The X20P airborne hyperspectral imager with a 20 MP ultra-high definition large surface array spectral detector can acquire hyperspectral images with 325 spectral channels in the range of 350~1000nm.
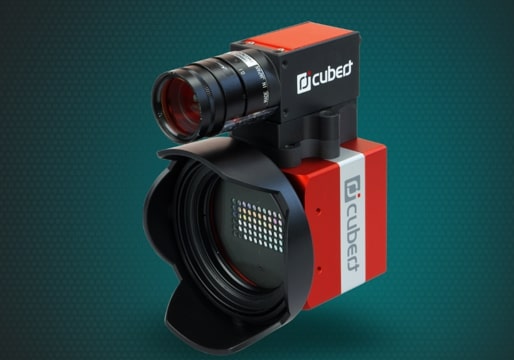
Fig.2 X20P airborne hyperspectral imager
The seamless integration between the CW-15 UAV and the lightweight X20P imager, along with the FlightSurv flight planning software, enables efficient data acquisition. The collected hyperspectral data is compatible with widely available processing software.
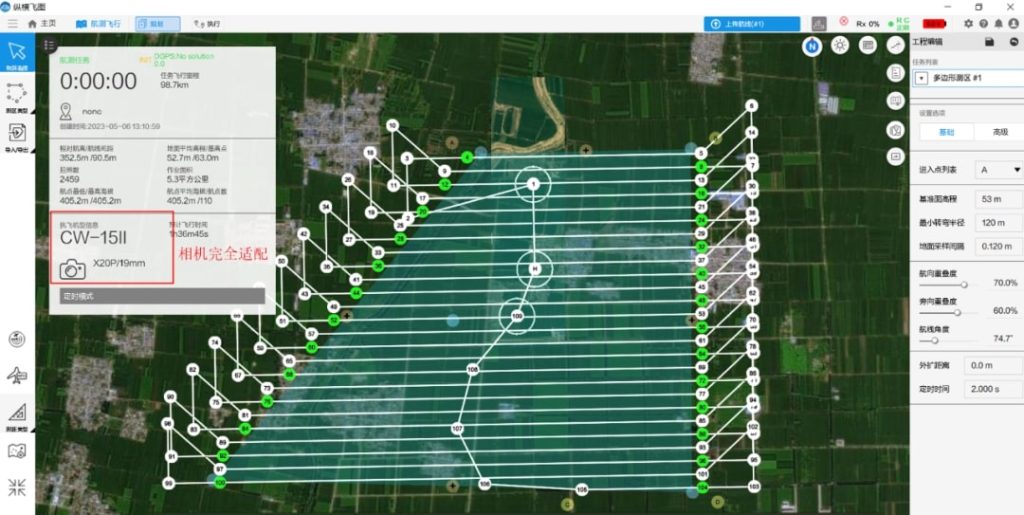
Fig.3 X20P hyperspectral camera and JOUAV FlightSurv are seamlessly integrated
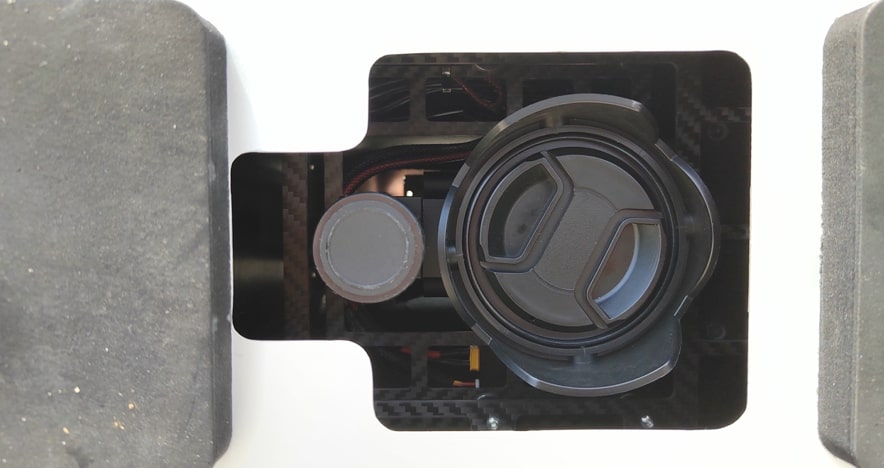
Fig.4 CW-15's pod is seamlessly integrated with X20P hyperspectral camera
Optimized Flight Parameters Enhance Accuracy
The flight was planned with a specific altitude of 350 meters, which allowed for a ground resolution (GSD) of 13 cm, ensuring detailed feature information. By flying at a higher altitude, a larger area could be covered while maintaining a higher image resolution.
The area covered in this flight experiment was 3 square kilometers and included diverse features like farmland, villages, roads, and planted forests. Considering the capabilities and flight planning of the CW-15 UAV, a single flight could actually cover an area of 6 square kilometers. Hence, only a fraction of the UAV's full potential was utilized for this particular experiment.
To ensure accurate and comprehensive data collection, the flight route was carefully designed with overlapping paths in mind. The heading overlap of this VTOL drone was set at 70%, meaning that there was a 70% overlap in the images taken between adjacent routes. In addition, the side overlap was set at 55%, ensuring that images captured along the same route also had some overlap. This overlap configuration was chosen to provide abundant data for subsequent processing and analysis.
24 Times Faster than Manual Methods!
The flight experiment took place on May 6, 2023, between 12:00 and 13:00 local time, lasting for one hour. The CW-15 UAV has a maximum flight time of two hours at full power, so this experiment consumed half of its endurance. Johny expressed his amazement at the performance of the CW-15, stating, "I am truly impressed by the CW-15's capabilities! It successfully completed a 3km² land hyperspectral acquisition in just one hour, which is an astonishing 24 times faster than the previous manual method."
"We collected a total of 800 hyperspectral images during the experiment, resulting in a data size of 1 terabyte. These data contain a wealth of spectral information that will facilitate comprehensive surveys and assessments of various features such as farmland, villages, roads, and planted forests," commented Johny.
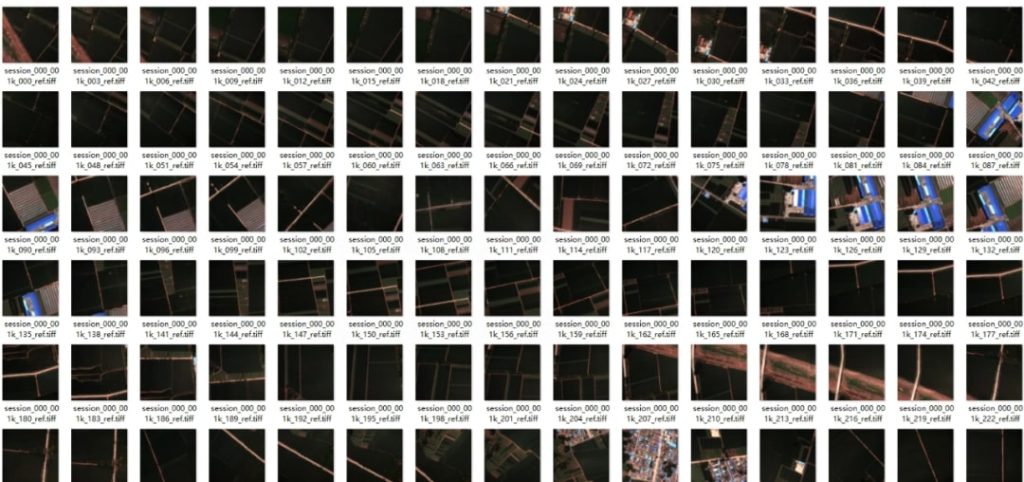
Fig.5 The X20P hyperspectral imager allows for automatic batch export of RGB single images.
High-Resolution Hyperspectral CIR Images in ENVI
After the experiment, Johny imported the captured hyperspectral CIR images, along with the single-band images at 650 nm and 812 nm, into ENVI software for processing and analysis. He reported: "The results reveal that these images exhibit well-defined edges, vibrant colors, and high contrast, demonstrating a significant improvement in quality compared to the previously captured images. This enhanced image quality enables us to easily identify and interpret targets in agricultural landscapes, including different crop types, buildings, and ground cover".
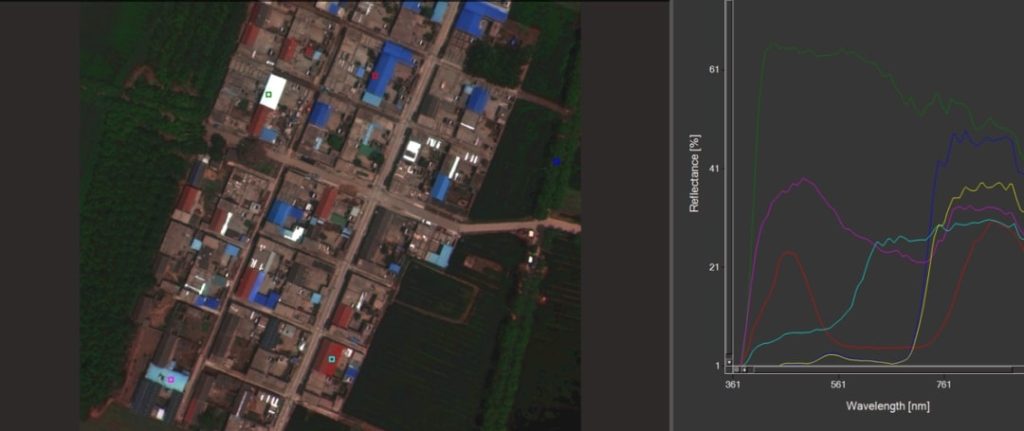
Fig.6 Single-view hyperspectral image display
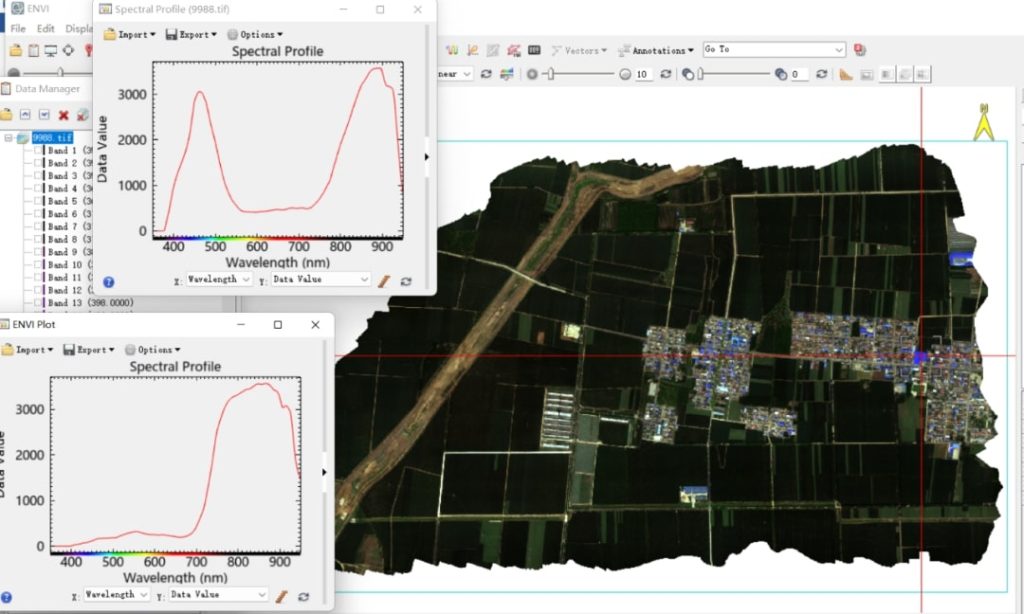
Fig.7 Hyperspectral RGB images opened in ENVI
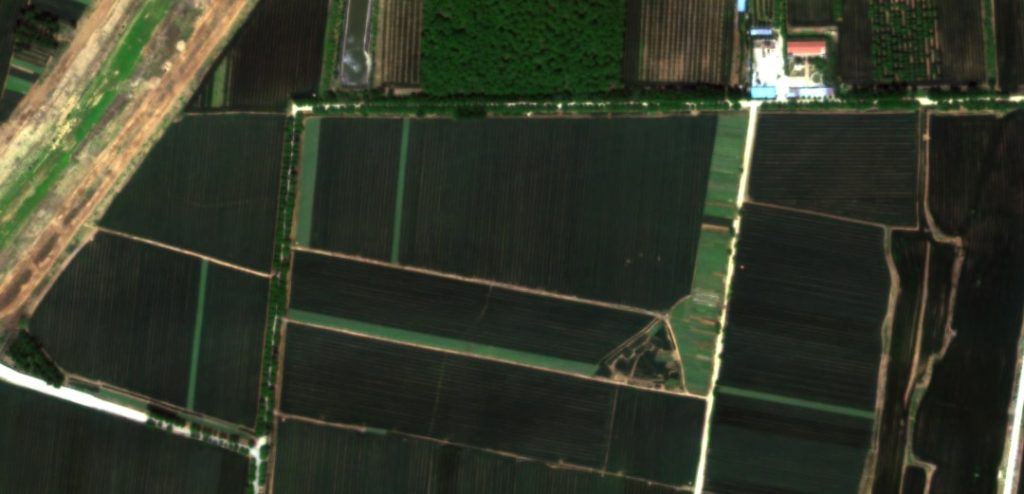
Fig.8 Local detail image of a hyperspectral image with no distortion and no misalignment
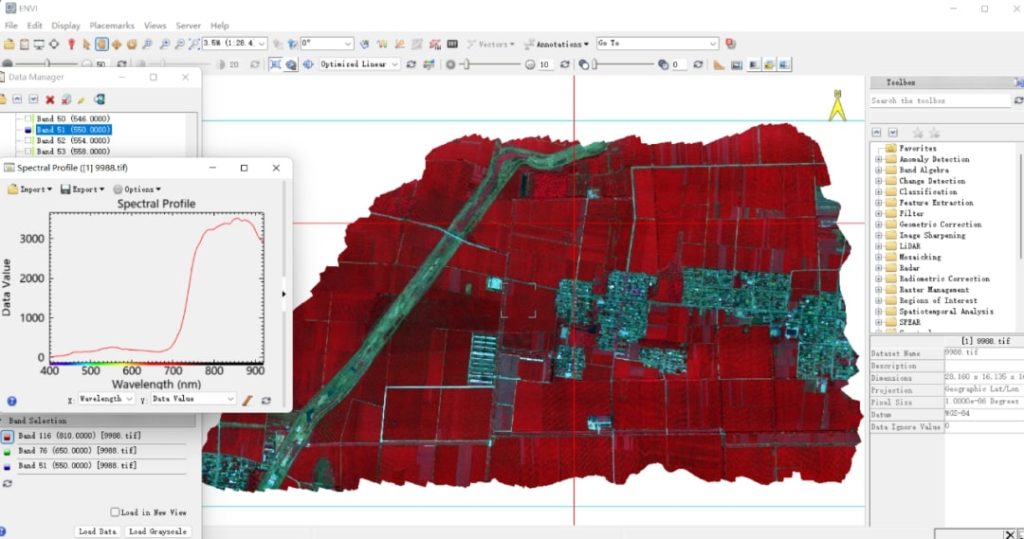
Fig.9 Hyperspectral CIR image opened in ENVI
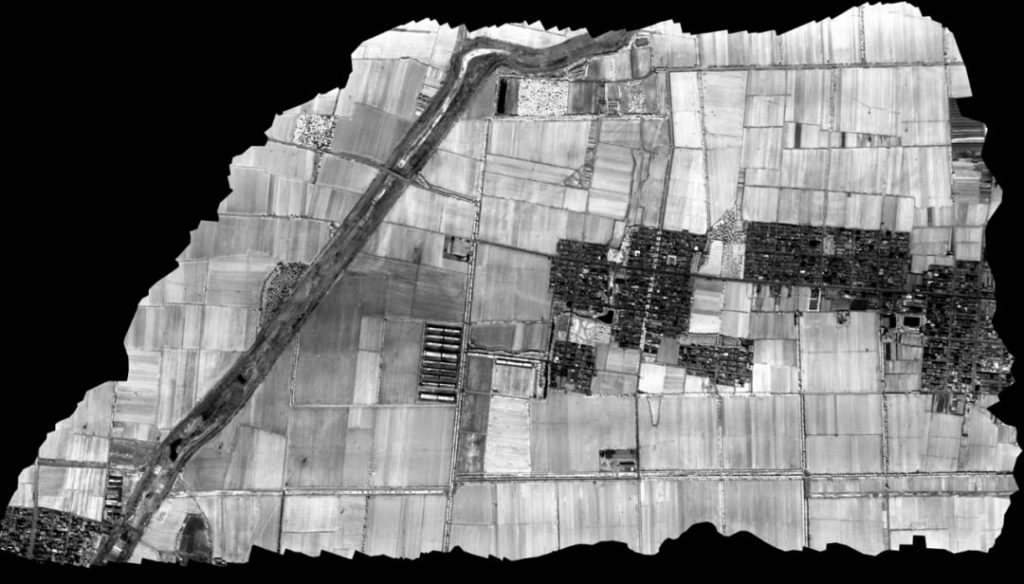
Fig.10 650nm single-band image opened in ENVI
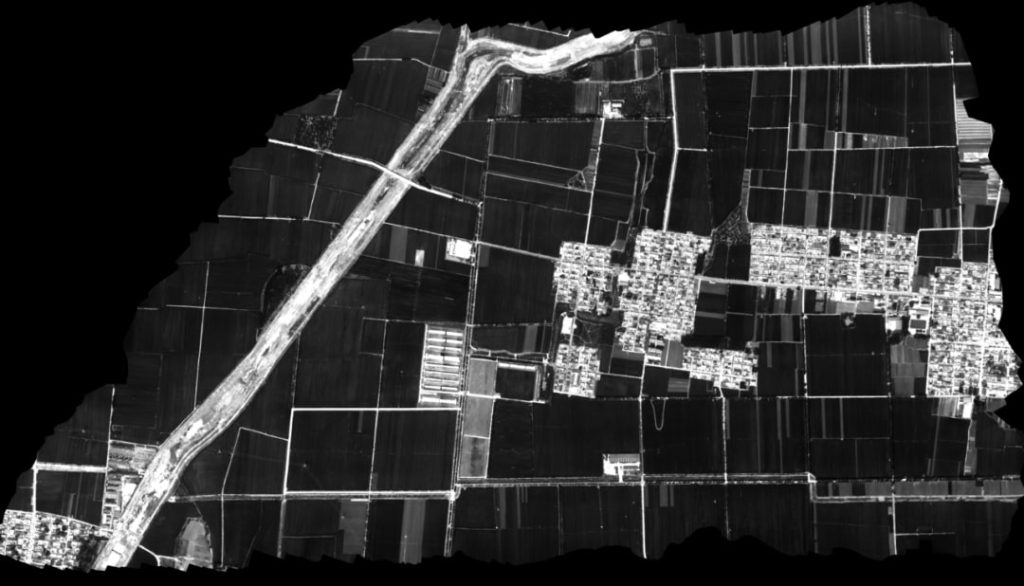
Fig.11 812nm single-band image opened in ENVI
SAM and NDVI Unlock Valuable Insights
To classify and identify the data, Johny employed the Spectral Angle Mapper (SAM) method within the ENVI software. Johny selected nine typical features for analysis, including planted forests, villages, red roofs, blue roofs, concrete pavements, bare soil, vineyards, garlic, and winter wheat.
Tips: Spectral Angle Mapping (SAM) is a prominent technique in hyperspectral image processing for feature classification and identification. It considers spectral data as vectors in a multidimensional space and calculates the angle between pixel spectra and spectral database spectra or pixel training spectra using analytical methods. By evaluating the angle magnitude, SAM determines the similarity between spectra, enabling effective feature identification. This method is particularly useful for analyzing the overall similarity of rock spectral shapes, enhancing spectral variability caused by illumination and topography. Its advantages are clearly evident in image classification tasks.
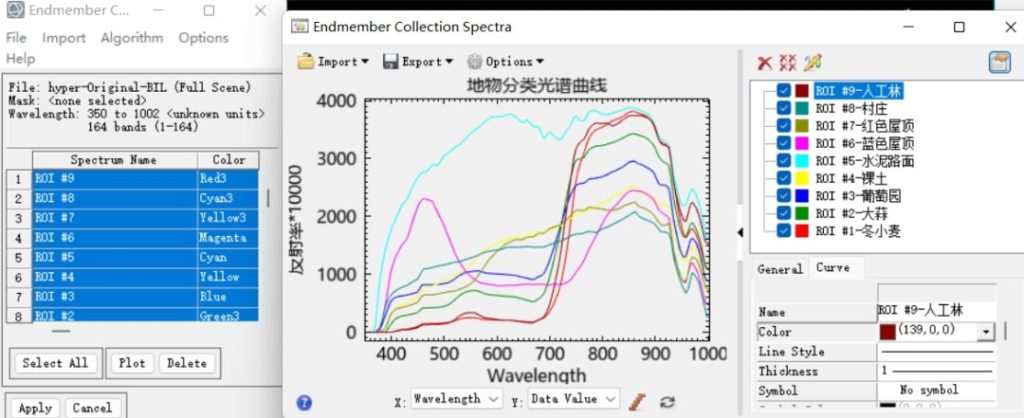
Fig.12 SAM-based spectral angle classification mapping in ENVI - Selection of 9 typical features
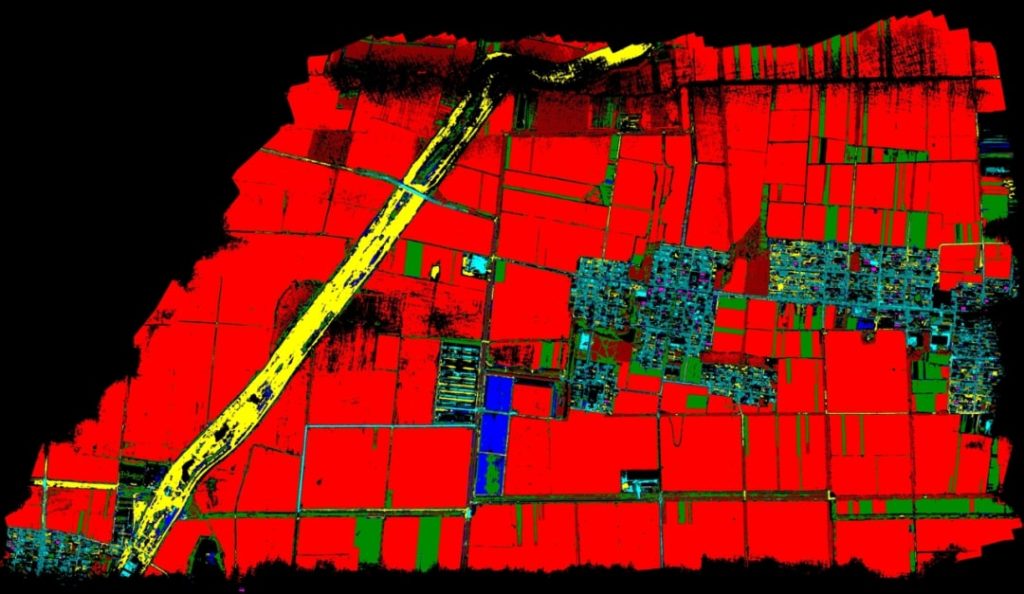
Fig.13 Results of SAM-based spectral angle classification mapping in ENVI
In the classification result mentioned above, different colors in the image correspond to various classification outcomes. Referring to the ROI legend, the red area indicates the presence of winter wheat, while the green area represents the garlic region.
Furthermore, Johny generated a Normalized Difference Vegetation Index (NDVI) using ENVI to assess the growth condition of winter wheat. Typically, a winter wheat crop in the filling stage should exhibit an NDVI value above 0.88. By analyzing the collected data from the flight test, Johny discovered that well-grown winter wheat displayed an average NDVI value of approximately 0.9, which can be observed in area 1 of Figure 14.
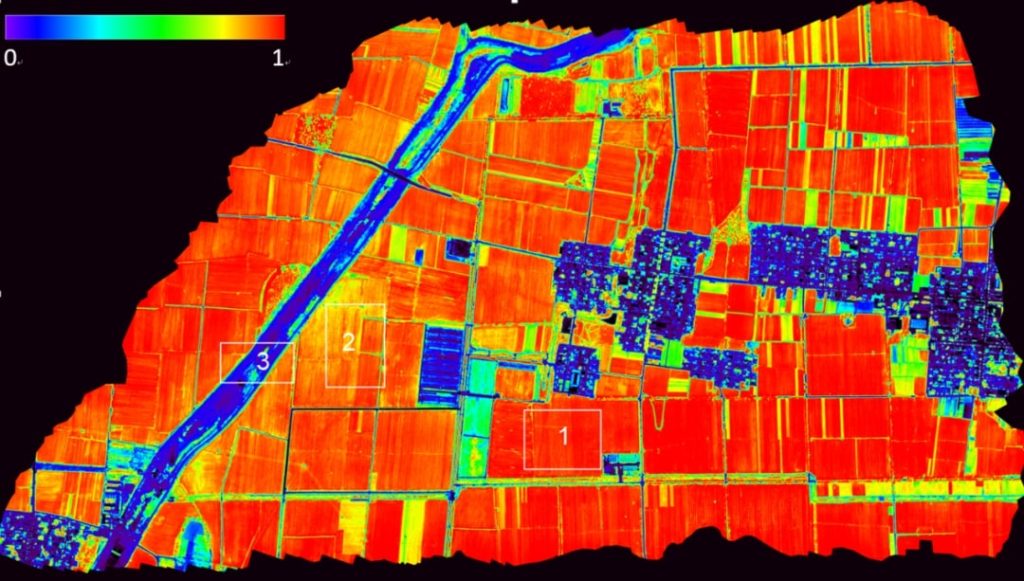
Fig.14 NDVI vegetation index images
Tips: NDVI, short for Normalized Difference Vegetation Index, is a crucial parameter used to assess crop growth and nutrient information in remote sensing images. It is calculated using the formula (NIR-R)/(NIR+R), where NIR represents the reflection value of the near-infrared band at 812nm, and R represents the reflection value of the red band at 650nm. NDVI, as the English abbreviation, serves as an important indicator for monitoring crop growth.
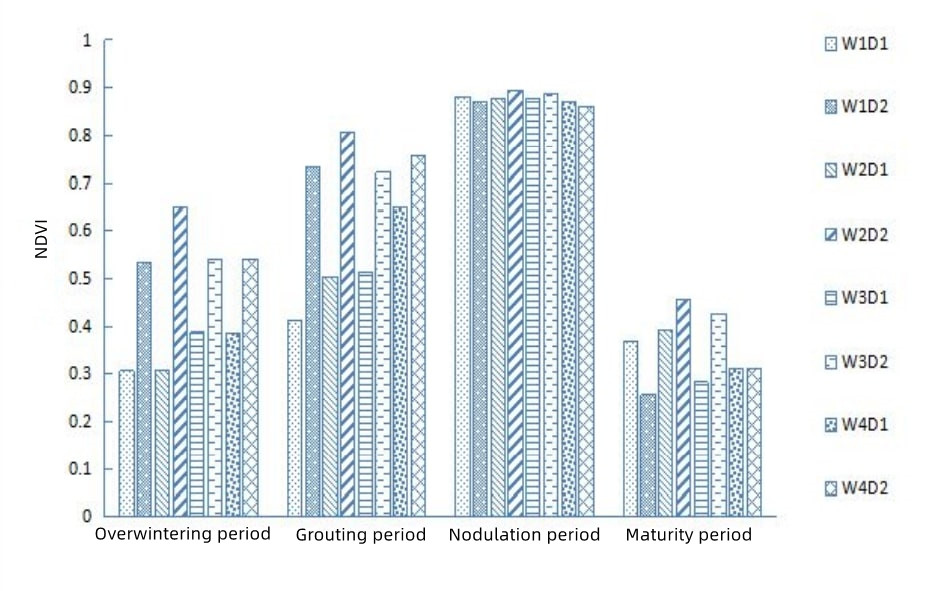 Fig.14 Main distribution of NDVI values in winter wheat at different growth stages (standard values above 0.88)
In the test area, most of the winter wheat exhibited NDVI values above 0.88, indicating a favorable growth status. On the other hand, poorly grown winter wheat exhibited an NDVI value around 0.8, primarily in areas like the sides of dry rivers, visible in area 2 of Figure 14. The NDVI value for bare soil was approximately 0.15, consistent with the expected NDVI value distribution criteria, as depicted in area 3 of Figure 14.
"These findings align with real-world conditions and further validate the effectiveness of the CW-15 UAV with the X20P hyperspectral camera for agricultural monitoring and management," concluded Johny.
Conclusion
In this experiment, a longer period of research could not be conducted due to time constraints. However, subsequent studies can combine the ground sampling data to further analyze the indicators of different lengths of winter wheat with the parametric model of hyperspectral vegetation index, and establish quantitative or semi-quantitative models between hyperspectral and nitrogen content, chlorophyll content, biomass, varietal differences and yield prediction of winter wheat.
The monitoring efficiency of winter wheat can be improved by CW-15 UAV with X20P hyperspectral imager. The flight test achieved satisfactory results in Yanzhou District, Jining City, Shandong Province, providing valuable data and insights for agricultural management. With the continuous development of UAV technology, it is believed that the application of UAVs will play an increasingly important role in the field of agriculture.
More Use Cases
Chongqing’s Qinba Mountains are basically a giant green wall protecting the region. But there’s a problem – pine wood nematodes are eating through it. Fast.
The forestry department n
When TotalEnergies set out to build one of Southeast Asia’s largest solar and battery storage projects—spanning 12,000 hectares across the dense acacia forests of Riau, Indonesia—they faced a problem

JOUAV Product News and Use Cases
Fixed-Wing VTOL Drones Insights and Industry Trends
Invitations to online demo events